 |
| Project Metadata | Keywords | ||||||||||||||||||||||||||||||||||||||||||||||||
|
|
The Air Force Research Laboratory (AFRL) is developing the National Operational Environment Model (NOEM). NOEM will support the examination of the ramifications (unintended consequences, both the short and long term) of potential actions on not just the adversary, but also on the environment and the innocent bystanders. Stottler Henke was selected to support the development of NOEM through its SimBionic© modeling system. Hartley Consulting was selected by Stottler Henke to aid in its Human, Social, Cultural Behavior (HSCB) modeling.
NOEM is a large simulation with many parts. The Stottler Henke contribution (the Gaming Layer for Exploring NOEM Strategies (GLENS)) would be just one of the parts. Because NOEM is currently a research project, many details have changed over time; however, the AFRL document gives some of the general concepts. The general scenario chosen to drive the modeling was the "Anbar Awakening" in Iraq. Several documents were used as source material (see References section).
Note that in the following material, the actual models are the work of Stottler Henke. This work is deemphasized to avoid appearing to claim credit for its work by Hartley Consulting. However, some discussion of the Stottler Henke work is required to make sense of the Hartley Consulting contribution.
The first phase of the project consisted of learning about NOEM and exploring the Anbar Awakening scenario. The focus of our work was to understand interest groups (IGs) in the scenario and formulate modeling concepts to deal with them.
The Anbar Awakening started in September 2006 with the formation of the Anbar Awakening Council by the tribes in the Anbar province of Iraq. It reversed the dominance of Al Qaeda in Iraq (AQIZ) within the Anbar Province.
The following is a very incomplete list of tribal powers active in Anbar province during the period of the Anbar Awakening. We included at least two from each major city (Fallujah, Ramadi), two from Hussein’s hometown of Tikrit, and two from Qaim, a border city important in the Awakening due to smuggling activity. Of these tribes, all but Zoba and Jabouri are subtribes of the dominant Dulaim tribe, sometimes referred to as the Dulaim federation.
|
Subtribe |
Tribe |
Location |
Affinities |
notes |
|
Zoba |
Zoba |
Albu Gharib, Fallujah |
Neutral/hostile to US, Neutral to all Dulaim |
|
|
Albu Mahall |
Dulaim |
al-Qaim |
Neutral to US, Hostile to AQ |
aligned with Nimr against AQ because AQ was taking over smuggling operations. Marines at first failed to take advantage of rivalry but later supported Mahal |
|
Al-Karabla |
Dulaim |
Al-Qaim |
Neutral/hostile to US, Hostile to Mahal |
Fought with AQIZ against Albu Mahal in al-Qaim |
|
Albu Issa |
Dulaim |
Fallujah |
Neutral to US, Hostile to Nasir, FRE insurgents |
Not strong supporters of Saddam; very nationalistic; early insurgents |
|
Al-Jumeilat |
Dulaim |
Fallujah |
Neutral/hostile to US, Neutral to all Dulaim |
|
|
Albu Risha |
Dulaim |
Ramadi |
Neutral/hostile to US, Hostile to AQ |
Sheikh Sattar al-Rishawi, leader of Albu Risha began the Awakening council in Ramadi |
|
Albu Fahd |
Dulaim |
Ramadi |
Neutral/hostile to US |
|
|
Albu Nimr |
Dulaim |
Ramadi, Hit |
Neutral to US, Hostile to Nasir, FRE insurgents |
One of the stronger tribes; rebelled pre-IAF in Ramadi area after torture and execution of Mazlum al-Dulamai. Aligned with Mahal in Qaim later and joined Awakening Council early |
|
Albu Nasir |
Dulaim |
Tikrit |
Neutral/hostile to US, Hostile to Issa, Nimr |
Saddam Hussein's tribe; includes many high ranking FRE’s |
|
Jabouri |
Zubaydi |
Tikrit |
Neutral/hostile to US, Neutral to all Dulaim |
|
The insurgent groups consisted of four main groups, two jihadist with strong foreign elements, and two homegrown with former regime elements (FRE):
|
Group |
Composition |
Location |
|
notes |
|
Ansar al-Sunna (Ansar al-Islam) |
Jihadists |
Primarily Mosul, also Fallujah and Baghdad |
Some rivalry with AQ |
Started as a Kurdish group fighting secular Kurdish parties; spread south and recruited Arab members for fight in Anbar |
|
al-Qaeda in Iraq |
Jihadists |
Active throughout Anbar |
Hostile to US, some rivalry with tribal powers and other insurgents, aligned with Al Karabla |
Foreign sponsorship and membership, although still majority Iraqi; tried to incite Sunni v Shi’ite violence; plays to foreign audience |
|
The Islamic Army in Iraq |
FRE |
Presence in Baghdad, Ramadi, Fallujah |
Alignment with Nasir, some rivalry with other insurgent |
High profile kidnappings to try to force foreign agencies and gov’ts out. Successful with Phillipines |
|
The 1920's Revolution Brigades |
FRE |
N/A |
some rivalry with other insurgent |
|
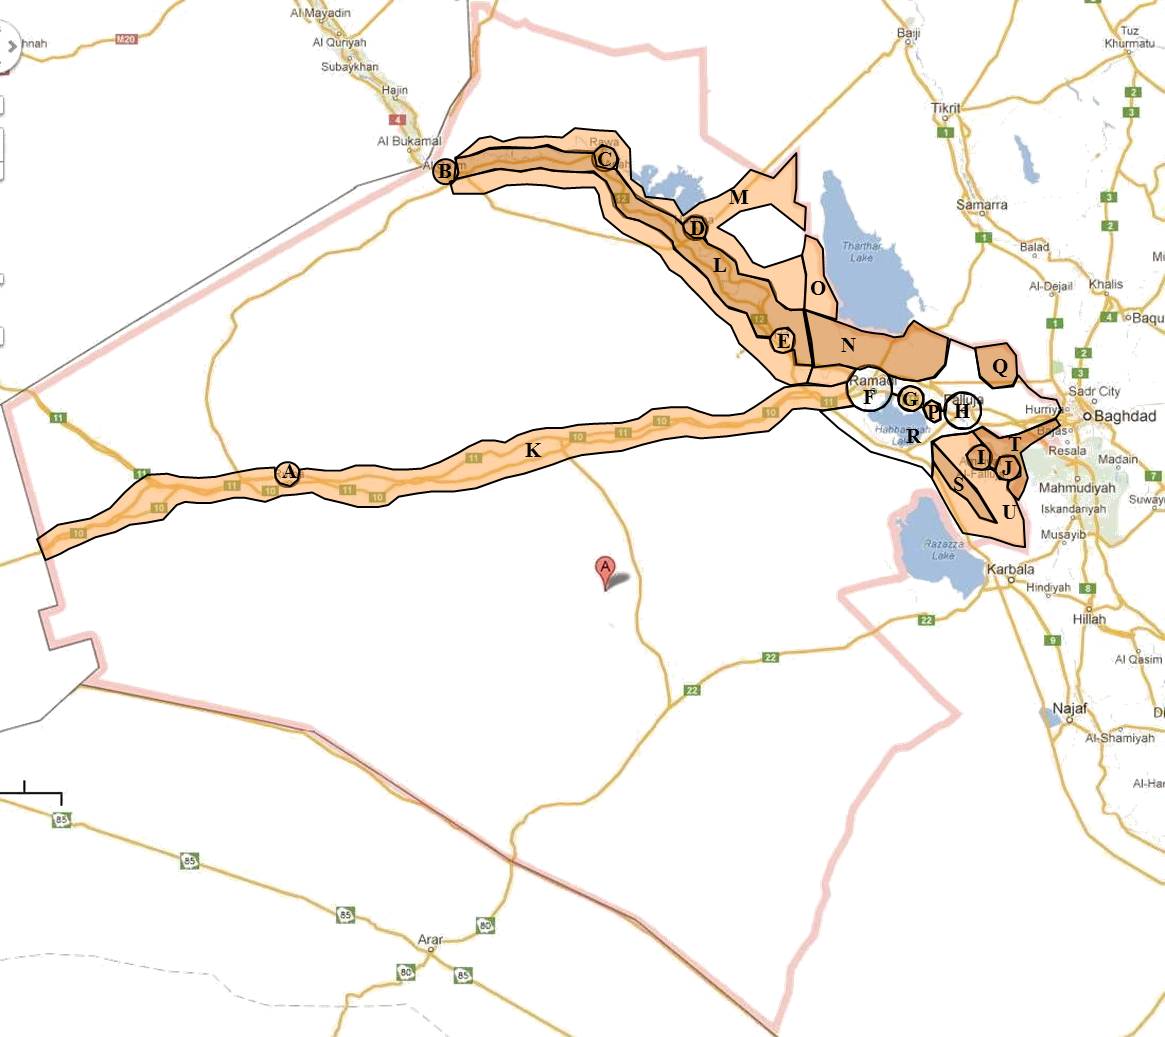
The map below gives a rough idea of the population distribution within the Anbar Province. The areas are labeled and the definitions are given in the following table.
 |
The table below was used to size and distribute the population and AQIZ forces within the areas. The population data was based on size estimates for the province and its cities' relative sizes, with additional distributions for populated areas near the cities, roads and rivers. The checksums box was used to test the distribution based on other information about the population distribution. The AQIZ numbers were based on assumptions for the meanings of the "light" and "heavy" designations given for each area. Different assumptions would produce different numbers.
| Label | Area | Dec 2008 Color | AQIZ Pop | CivPop% | Population |
| Anbar | 100.0% | 1,427,000 | |||
| A | Al-Rutba | light | 401 | 2.8% | 40,134.4 |
| B | Al-Qaim | heavy | 669 | 1.6% | 22,296.9 |
| C | Anah/Rawah | heavy | 936 | 2.2% | 31,215.6 |
| D | Haditha | heavy | 2,408 | 5.6% | 80,268.8 |
| E | Heet | light | 803 | 5.6% | 80,268.8 |
| F | Ramadi | none | - | 20.9% | 298,778.1 |
| G | Habbaniyah | light | 45 | 0.3% | 4,459.4 |
| H | Falluja | none | - | 16.3% | 231,887.5 |
| I | Amiriya | heavy | 134 | 0.3% | 4,459.4 |
| J | Yusufiyah | heavy | 134 | 0.3% | 4,459.4 |
| K | Road 10 from Ramadi through Al-Rutba to border (without cities) | light | 50 | 0.4% | 5,000.0 |
| L | Along river from Al-Qaim to between Heet and Ramadi | heavy | 2,550 | 6.0% | 85,000.0 |
| M | Surrounding above area | light | 300 | 2.1% | 30,000.0 |
| N | From between Heet and Ramadi looping around South end of lake North of Ramadi | heavy | 3,450 | 8.1% | 115,000.0 |
| O | Surrounding above area (including West side of lake) | light | 500 | 3.5% | 50,000.0 |
| P | Pocket West of Falluja (from Falluja to small lake) | light | 150 | 1.1% | 15,000.0 |
| Q | Larger Pocket Northeast of Falluja & Northwest of Baghdad | heavy | 600 | 1.4% | 20,000.0 |
| R | Area between Falluja and Ramadi (not including pockets) | none | - | 6.1% | 87,000.0 |
| S | Beanpod South of Falluja (from Southeast tip of small lake running Southeast to Kerbala) | heavy | 1,200 | 2.8% | 40,000.0 |
| T | Tau-shaped area Southeast of Falluja (running along river to Babylon with East leg running to City of Baghdad) | heavy | 2,460 | 5.7% | 82,000.0 |
| U | Surrounding beanpod and area between it and tau-shaped area | light | 1,000 | 7.0% | 100,000.0 |
| Total | 17,790 | 100.0% | 1,427,228 | ||
| Checksums | |||||
| urban pop % = 52% | 55.9% | ||||
| Ramadi + Falluja Districts = almost 75% | 72.9% | ||||
| Assumptions on AQIZ | |||||
| heavy, % of pop | 3% | ||||
| light, % of pop | 1% |
We realized that there would be a problem in entering this or any similar general population and IG population data into a simulation. The area being simulated would be represented by a set of cells (of as yet unspecified size, perhaps specified with the particular scenario) and that the population and IG population numbers would not be available for these cells from any authoritative source. Some algorithm with features similar to those described in the table above would be needed to populate the cells. Further, scenario variants would change the distributions given by any data source. We needed to define an algorithm that would work both for the raw data and for the scenario variants.
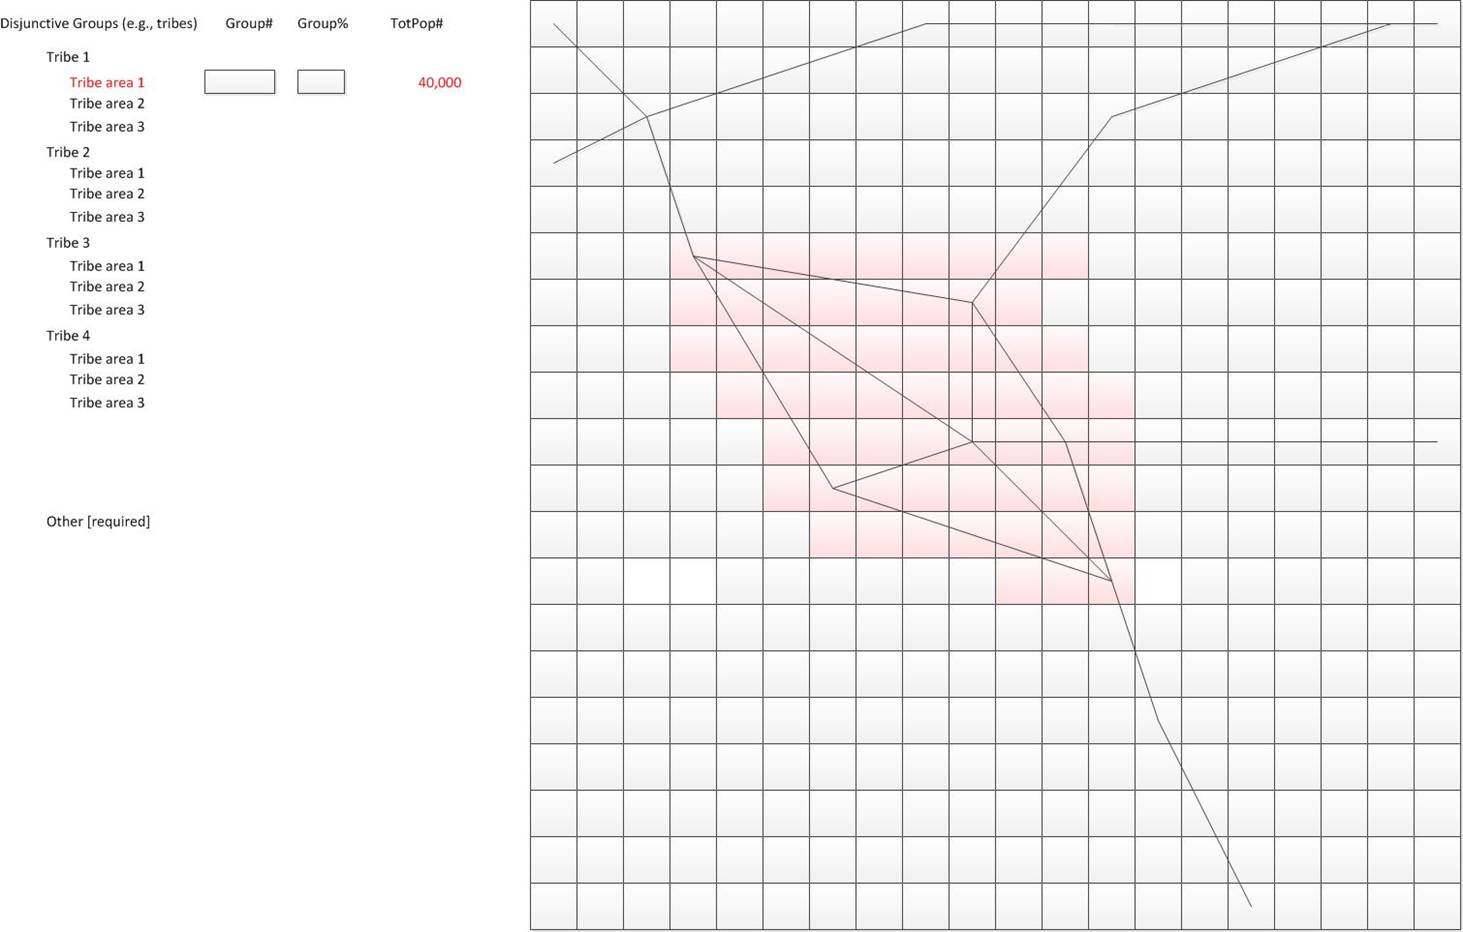
Assume the total population has already been distributed over the grid cells. One concept is shown for the figure below:
Enter tribe names, replacing the "Tribe 1," etc., designations.
Enter a tribal area name, replacing the "Tribe area 1," etc., designations.
Select the area on the map using a GUI tool (e.g., the pink area in the grid).
Program shows total pop for area.
Enter either tribal pop for area or tribal % for area in the appropriate box.
Program calculates the other number.
After all are entered, program shows grid squares with excess specified population for manual correction.
Unspecified numbers become “Other” category. Coalition forces will either be assigned to a "Coalition" tribe or make up the "Other" category, depending on the scenario.
 |
This concept assumes a tribal society in which all population members can be assigned to a single tribe (or "Other") category. There are four other important categories that cut across the tribal designations: religious affiliation, social group affiliation, political group affiliation, and security group affiliation. Any person is assumed to have an affiliation to one group (including an "Other" group) in each category.
In addition to the affiliation assignments, each person has an affinity toward other groups and to his own group. For example, a person might be a Sunni, but could have an extremely strong, moderate, or only weak affinity to the Sunni religion. The same person could have a violent aversion, no aversion, or a liking for Shias. These affinities have to be defined and assigned.
The second phase of the project consisted of building GLENS SimBionic modules to implement concepts for IG interactions. We proceeded with a spiral design and implementation approach, using the Eclipse modeling environment to implement Java code and connect to the SimBionic code. These modules were implemented as stand-alone models to demonstrate concepts.
We began with the Epstein model (see References), modeling the proposed influences of local police on a population with tendencies toward rebellion. For the initial effort, we had a single tribe/religion, labeled Sunnis, an AQIZ element to influence toward rebellion, and a local police force to detect and jail those with high rebellious tendencies. We were successful in demonstrating that the models could implement a version of the Epstein model.
The third phase of the project had two parts. One part consisted of working with another NOEM contractor to integrate the GLENS SimBionic model with the rest of NOEM. The other part consisted of using a file of environmental elements (in this case water supply facilities distributed over the geography of Iceland) to demonstrate the actions of the population when there was inadequate availability of a resource (in this case water).
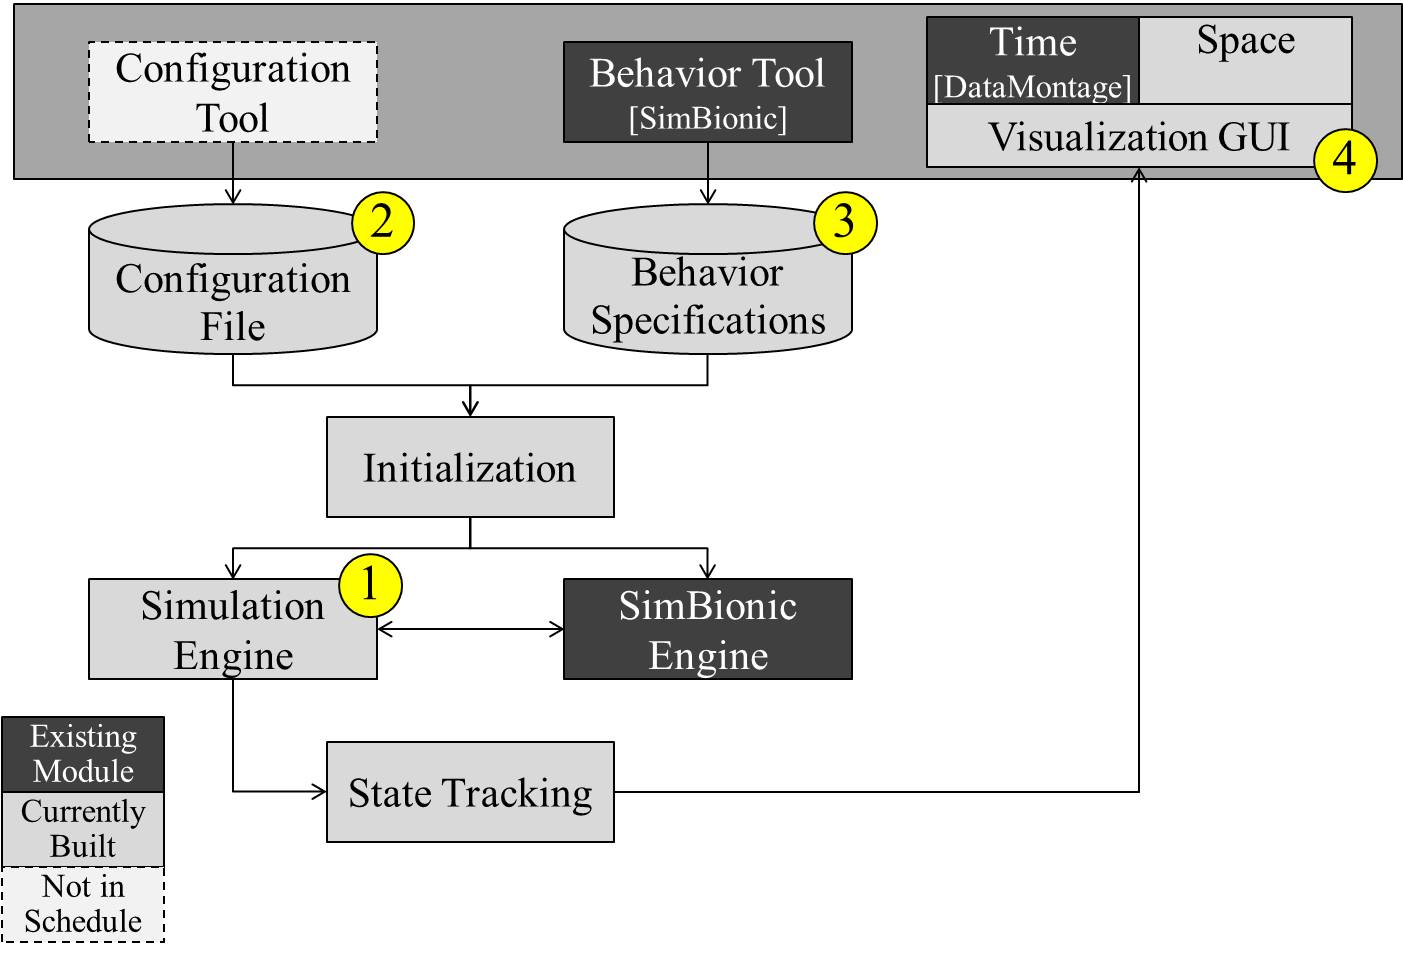
We added a need for water (the agent died after a number of days without water), a knowledge of where there was more water, the ability to travel toward a goal (a better water facility), and the ability to carry some quantity of water (but dying if the quantity turned out to be inadequate). The various quantities were input values and many of the capabilities were randomly assigned to the agents so that there would be variation in the individual actions. The figure below indicates the architecture of the GLENS model, leaving out any connection to NOEM.
 |
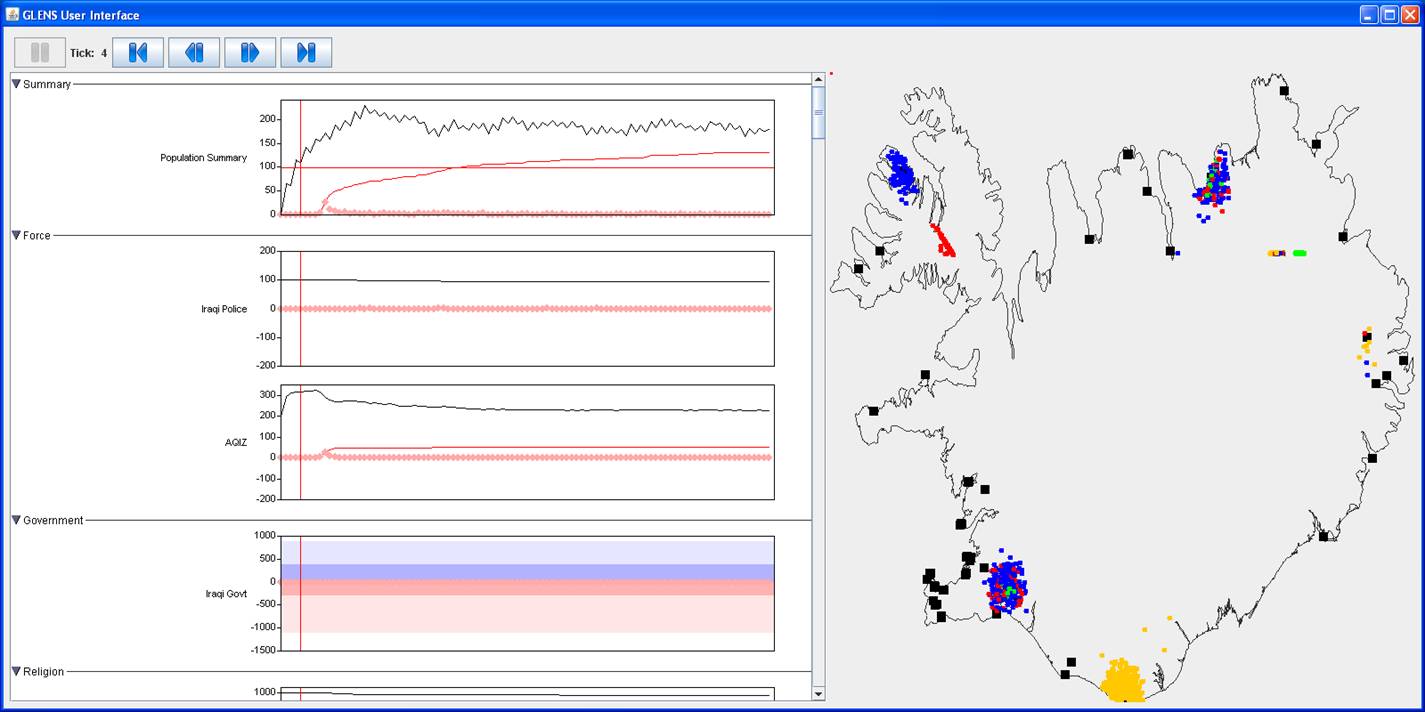
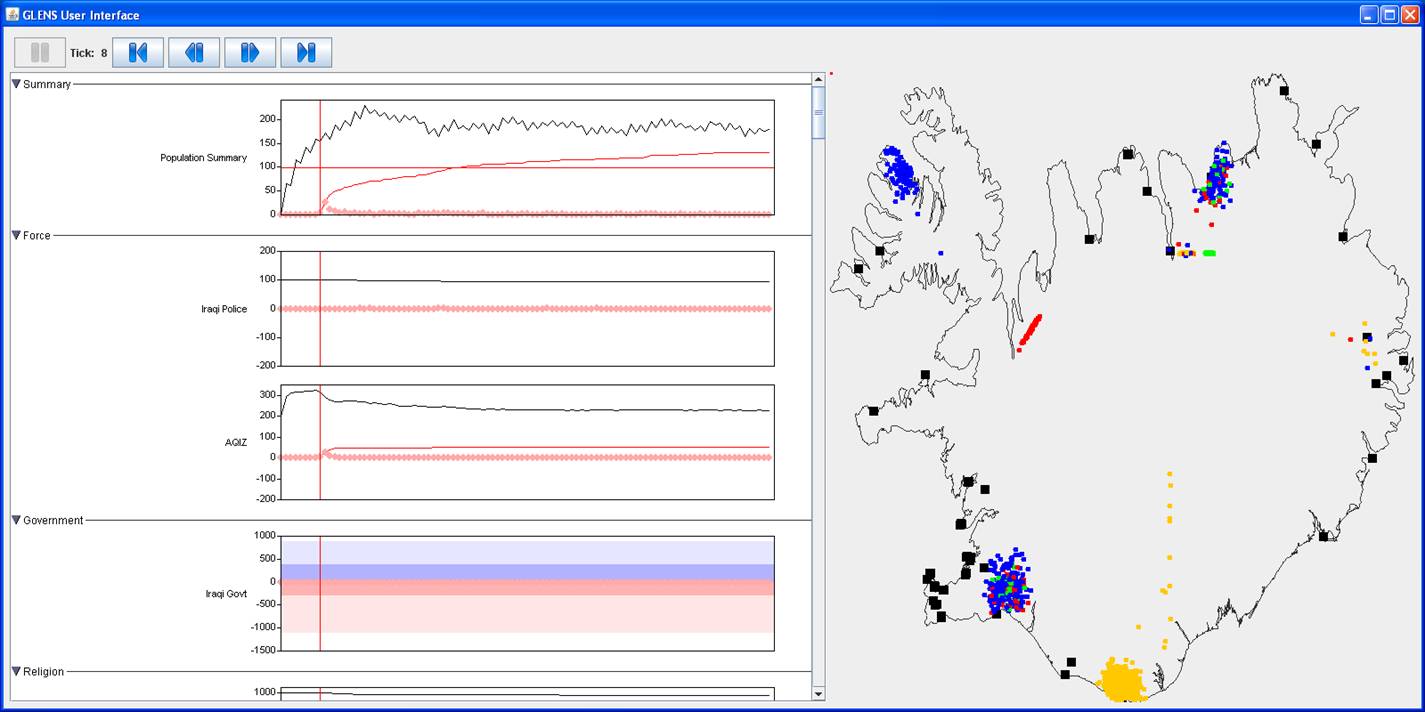
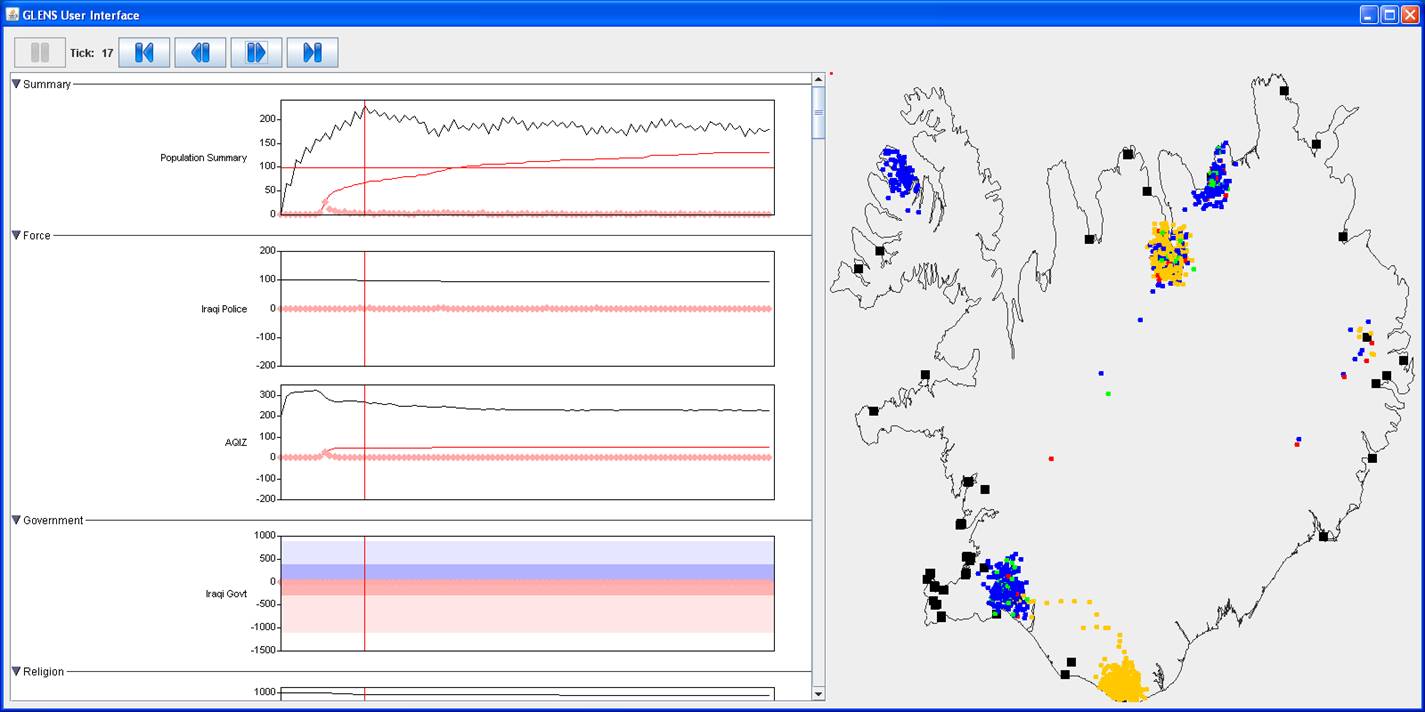
The figures below show some of the interesting output from one run of the model. During the model run, the agents move around on the map and the time line graphs are created. After the run, the time can be reset to show the position of the agents at that time (Tick). The graphs, however, show their full set of values. The agents are color-coded: blue for Sunni, yellow for Shia, green for police and red for AQIZ. The black squares are water facilities.
| Start: Tick 0 All agents are located at one of five water facilities. Sunnis only at upper left, Shia only at bottom center, Sunni, Police & AQIZ at bottom left and top right, and all four at right center. |
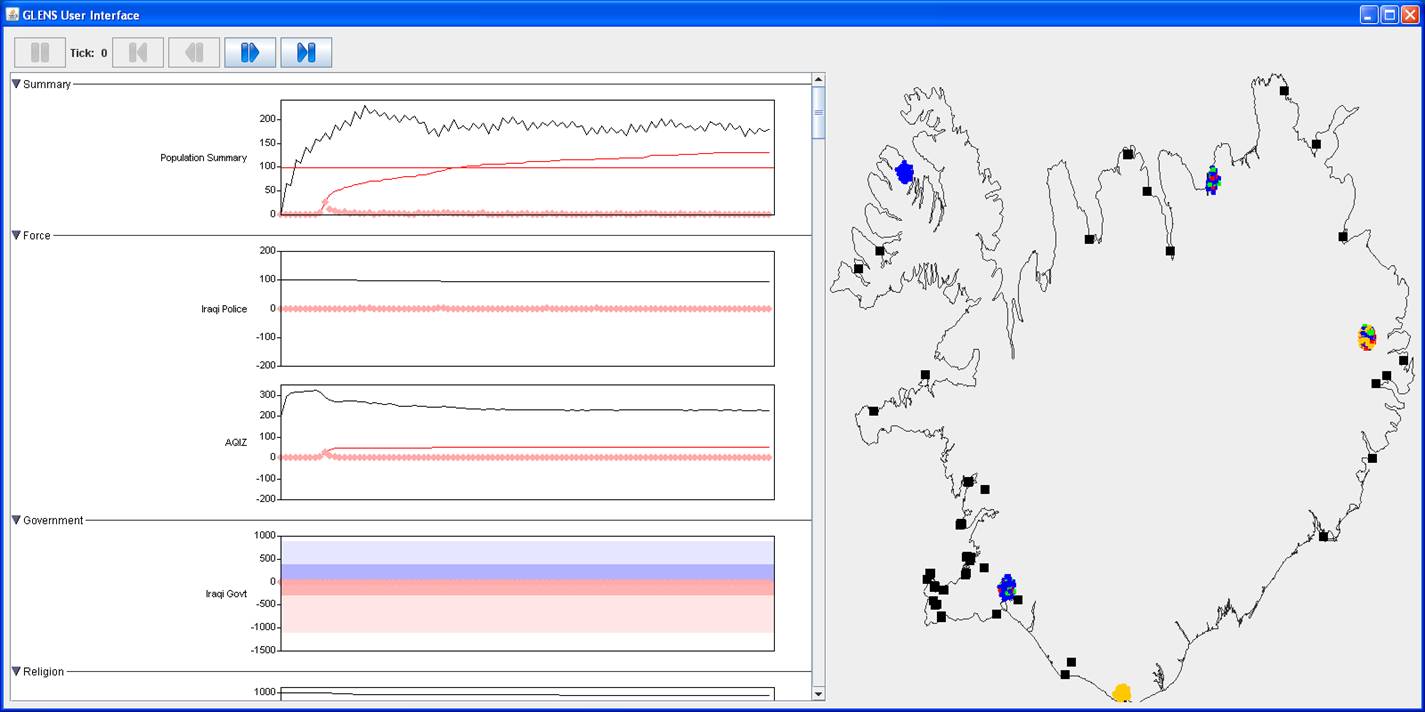 |
| Tick 4 A group of Sunnis have converted to AQIZ and are leaving for a different water facility at top left. A mixed group is leaving from the right center location. All locations are spread out from random movement. The third graph shows the number of AQIZ on the black line. It shows a distinct rise about Tick 1 and 2, because of the conversion of Sunnis to AQIZ. |
 |
| Tick 8 The AQIZ from the top left location are still in motion. Many will die. A number of agents from the center right location and the top right location have arrived at a new water facility at top center. A stream of agents is leaving the bottom center facility, heading for the top center location. Many will die. The AQIZ graph (third one down) shows the beginning of the AQIZ deaths. The fuzzy thick pink line shows the rate of deaths and the thin red line shows the cumulative deaths. These are the AQIZ stream running out of water. |
 |
| Tick 17 The top center location now has a great number of agents of all types. The agents from the bottom center location are migrating to the bottom left location. They will continue to do this. The red line in the top graph shows the cumulative number of people who have died (from lack of water). The rate peaked about Tick 9, but the number of deaths continues over the whole run. The black line in the top graph shows the number of people in "jail" for rebellious tendencies. |
 |
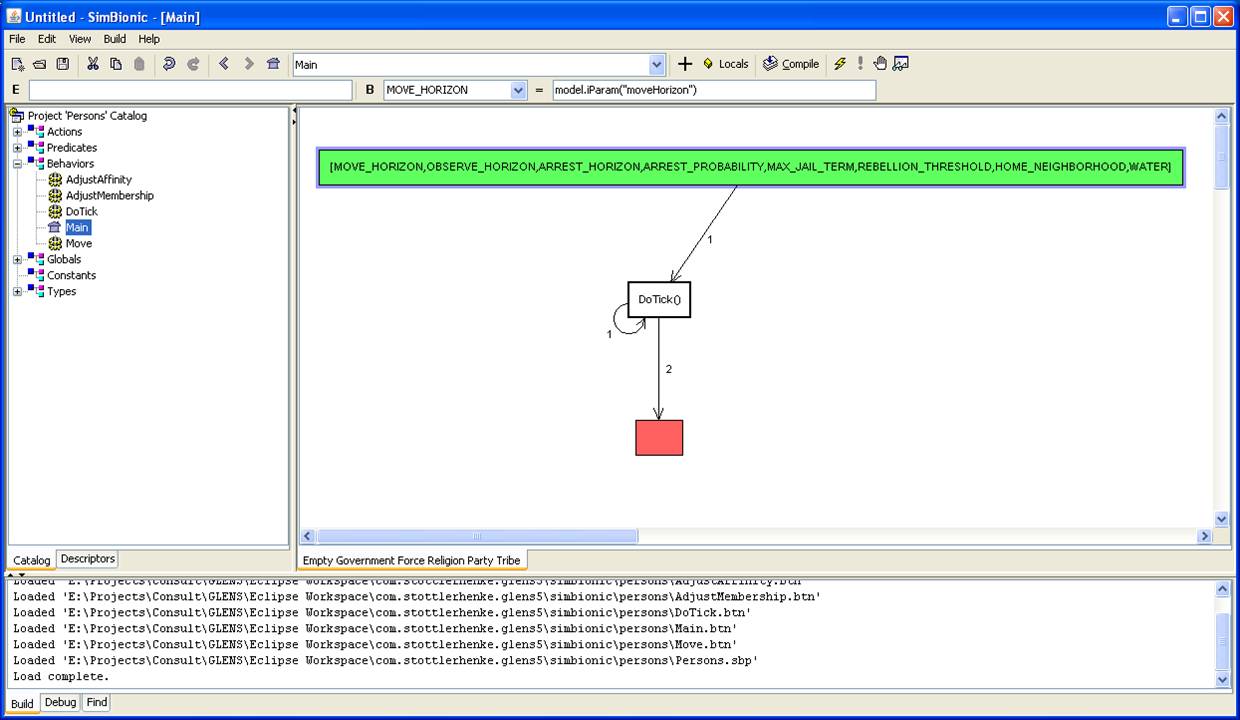
The graphical representation of the SimBionic logic is shown in the figures below.
| The Main diagram consists of
initialization, iteration over the desired number of time steps
(Ticks), and ending. The symbology in all diagrams is consistent: a green box is the starting point and a red box is the ending point. Boxes represent processes and ovals represent condition tests. If multiple arrows leave a symbol, they are processed in the sequence of the numbers attached to the arrows. In this case, the iterate arrow is processed before the arrow leading to the end box. |
 |
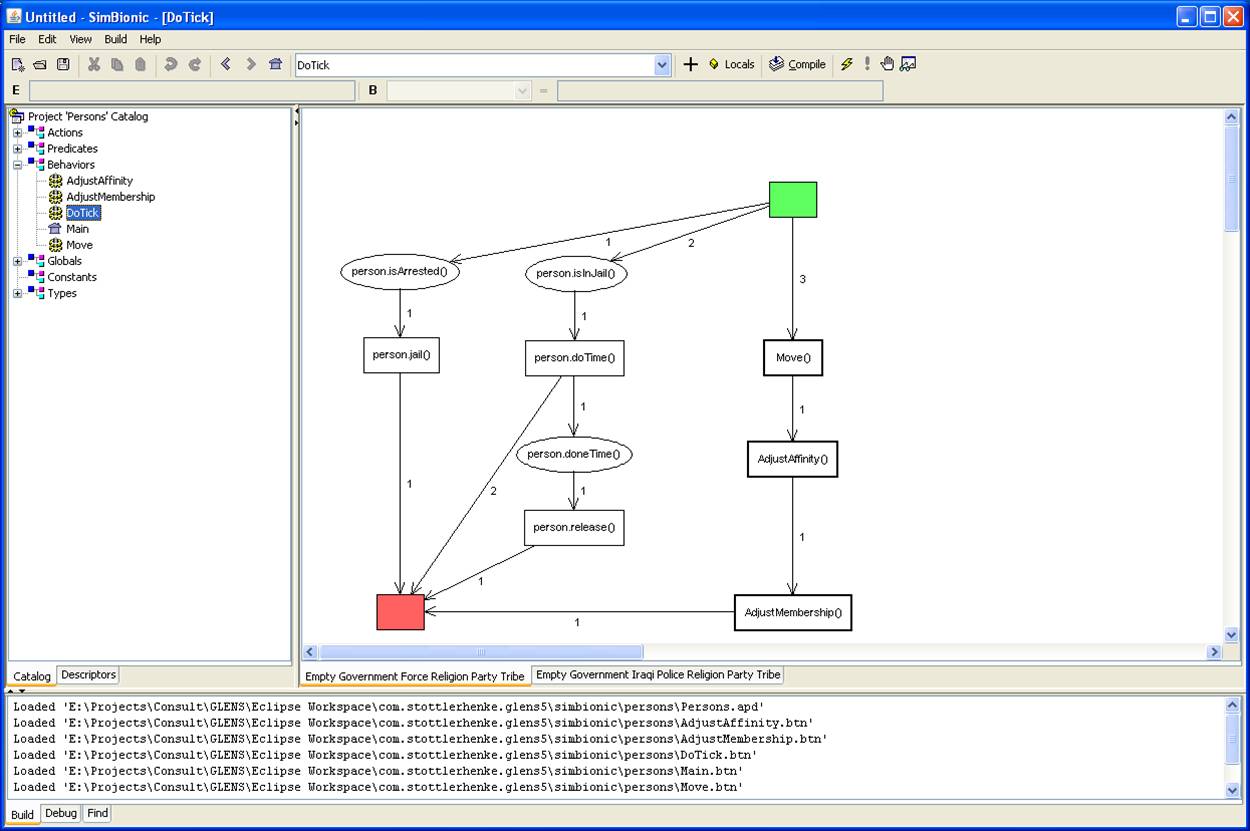
| The DoTick process expands into two
cases. This is the general case (when the other case doesn't apply). First, the agent being processed is checked to see if he is arrested. If so, he is put in jail. Then the process ends. If the agent is not arrested, he is checked to see if he is in jail. If so, he does time. Then he is checked to see if he has done his time. If so he is released. Then the process ends. If he has not done his time, the process ends. If the agent is not arrested or in jail, he does the Move process. Then he does the AdjustAffinity process. Then he does the AdjustMembership process. Then the process ends. |
 |
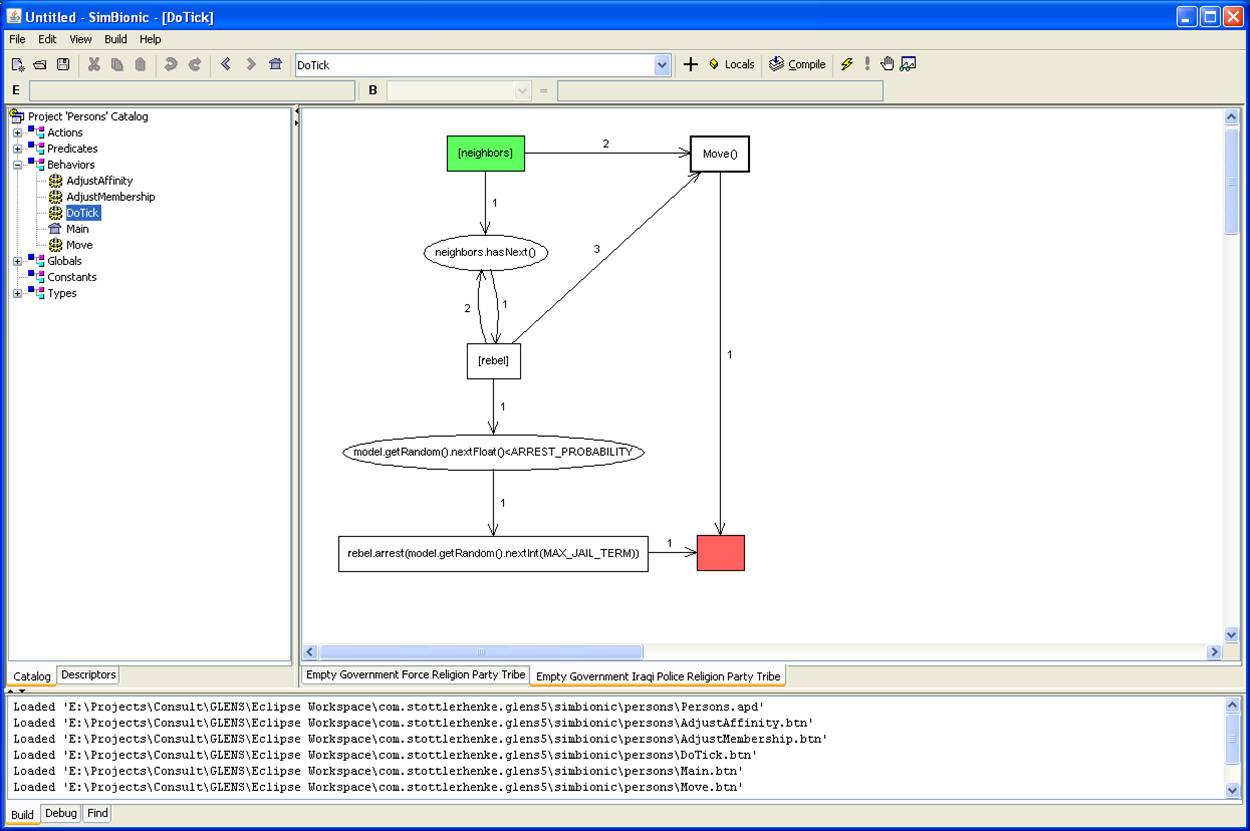
| This is the DoTick process for the case
that the agent is a policeman. First the agent is checked to see if there is a next neighbor. If so, a process is performed to calculate whether the neighbor is going to convert to a rebel.
If in the first case, there was no neighbor, the policeman moves and the process ends. |
 |
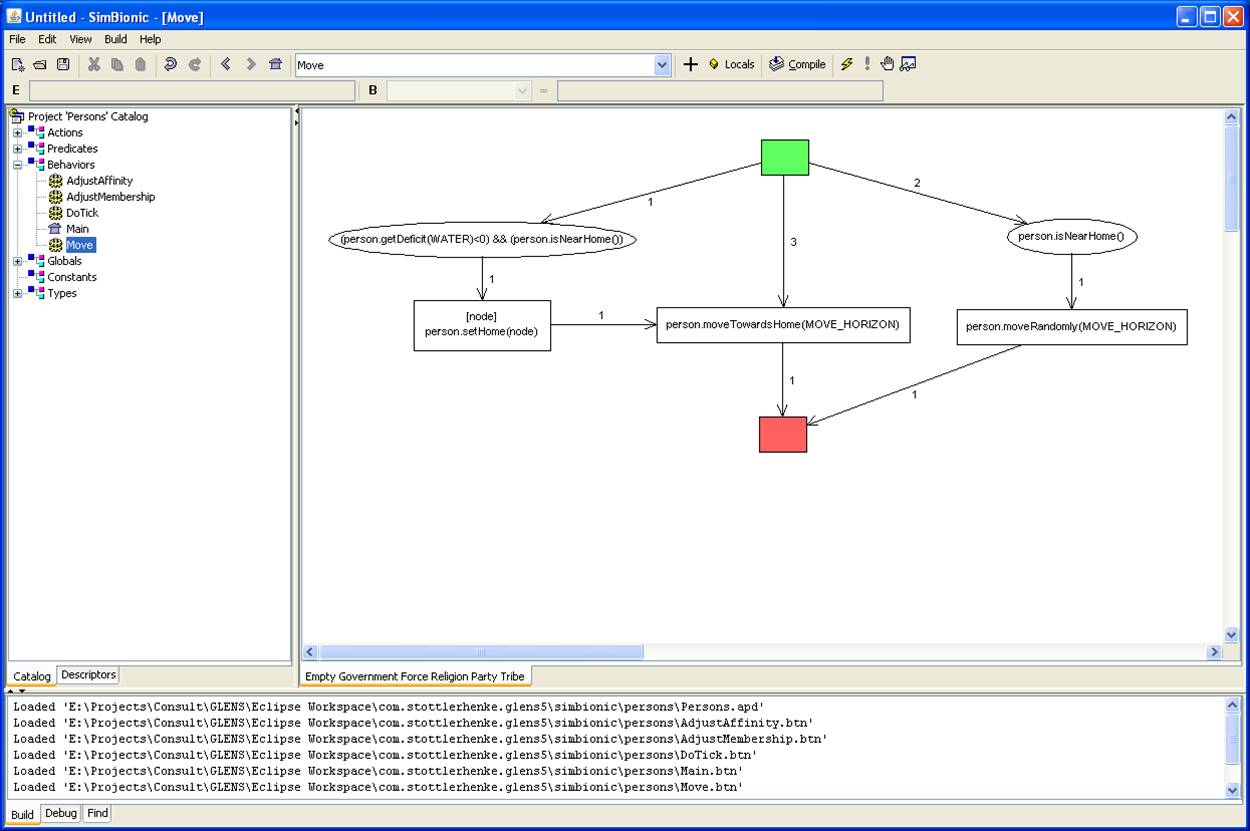
| This is the Move process. First, the agent is checked to see if he has a water deficit and is near his home. If so, he redefines home to a node that has water. Then he moves toward home and the process ends. If this test fails, he is checked to see if he is near home. If so, he doesn't have a water deficit and moves randomly. Then the process ends. If both tests fail, he either has a water deficit and isn't near home or doesn't have a water deficit but has wandered a little too far from home. He moves toward home (either his original home when he doesn't have a water deficit or to a new home that has water) and the process ends. |
 |
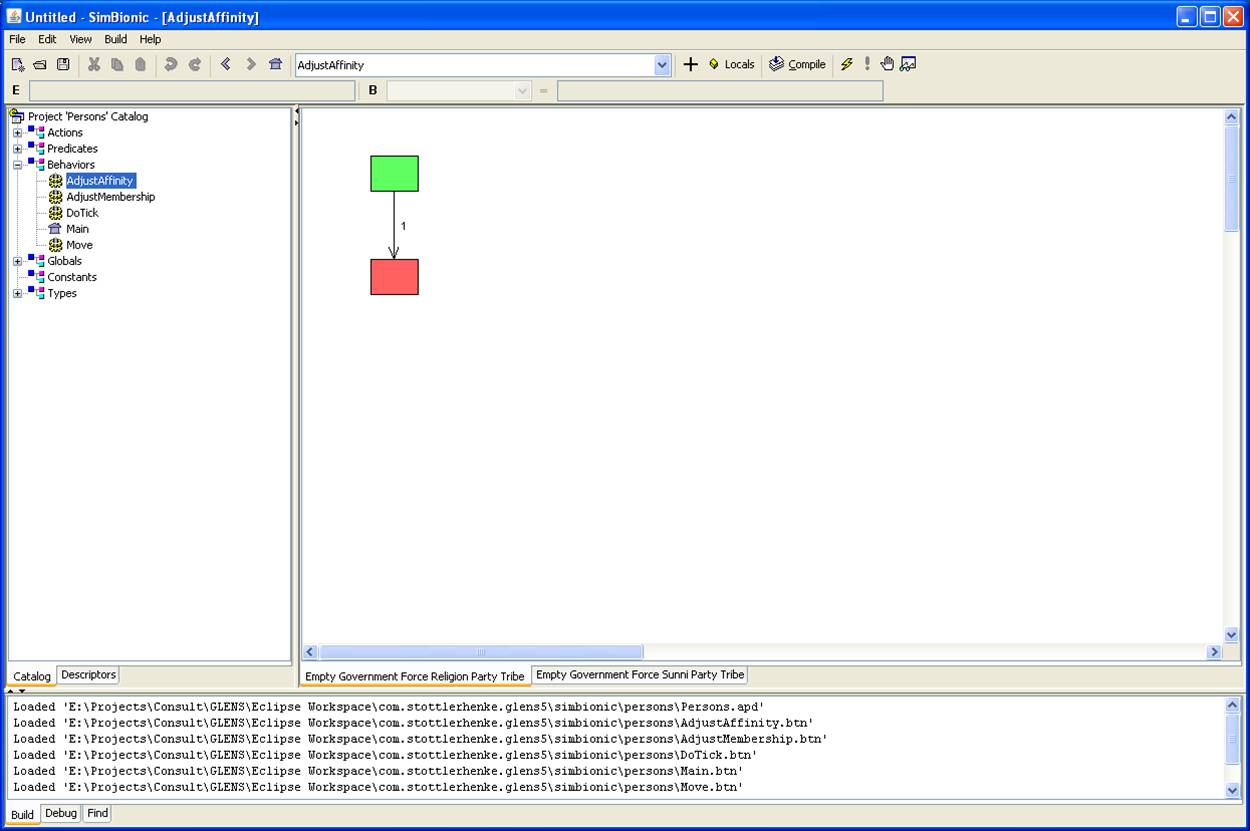
| This is the general case for the
AdjustAffinity process. Nothing changes. |
 |
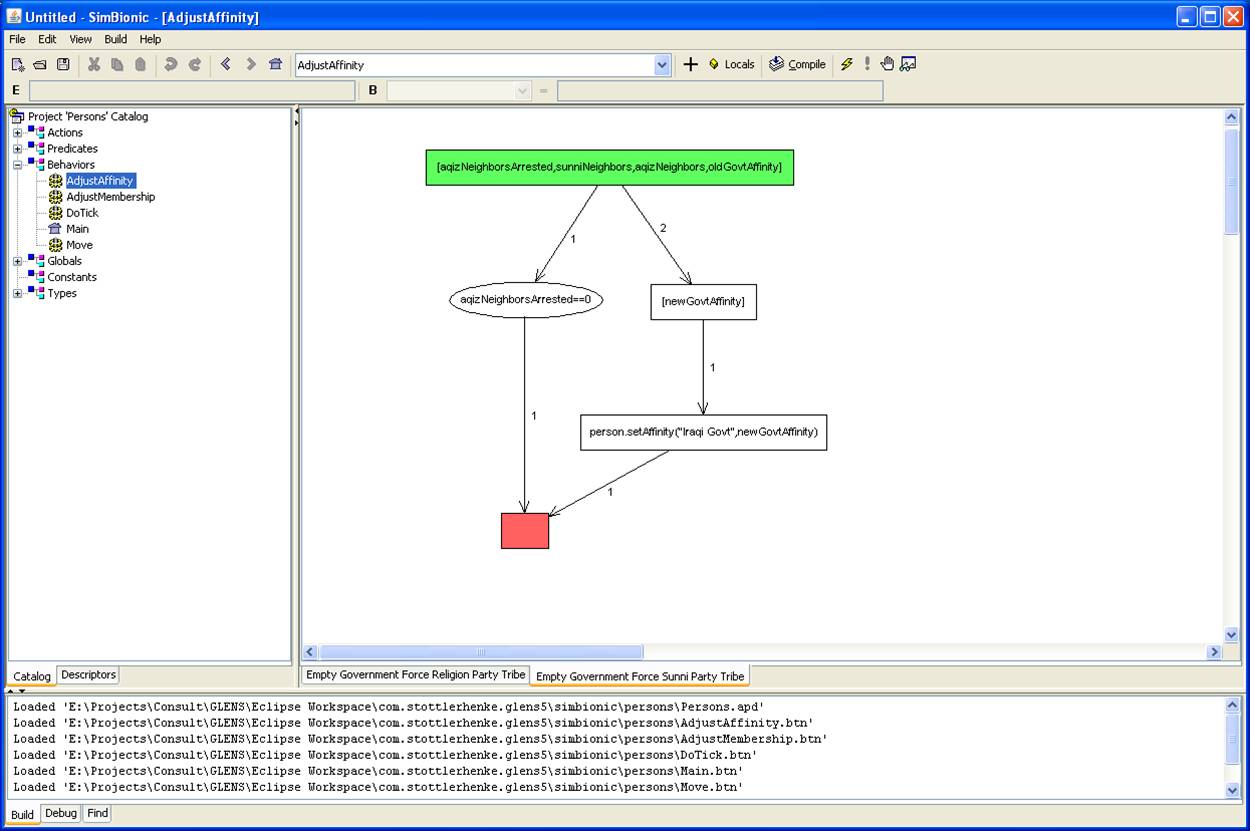
| This is the AdjustAffinity process for
Sunni agents. (For a more complex model, there would be cases for
the other types of agents.) First, the condition for neighbors being arrested is tested. (The agent doesn't risk changing affinity toward the government.) If so, the process ends. Otherwise, a new affinity for the government is calculated. (The only affinity implemented in this simple model is for the government. This is what drives rebellion and arrest.) Then the new affiinity is implemented in the agent and the process ends. |
 |
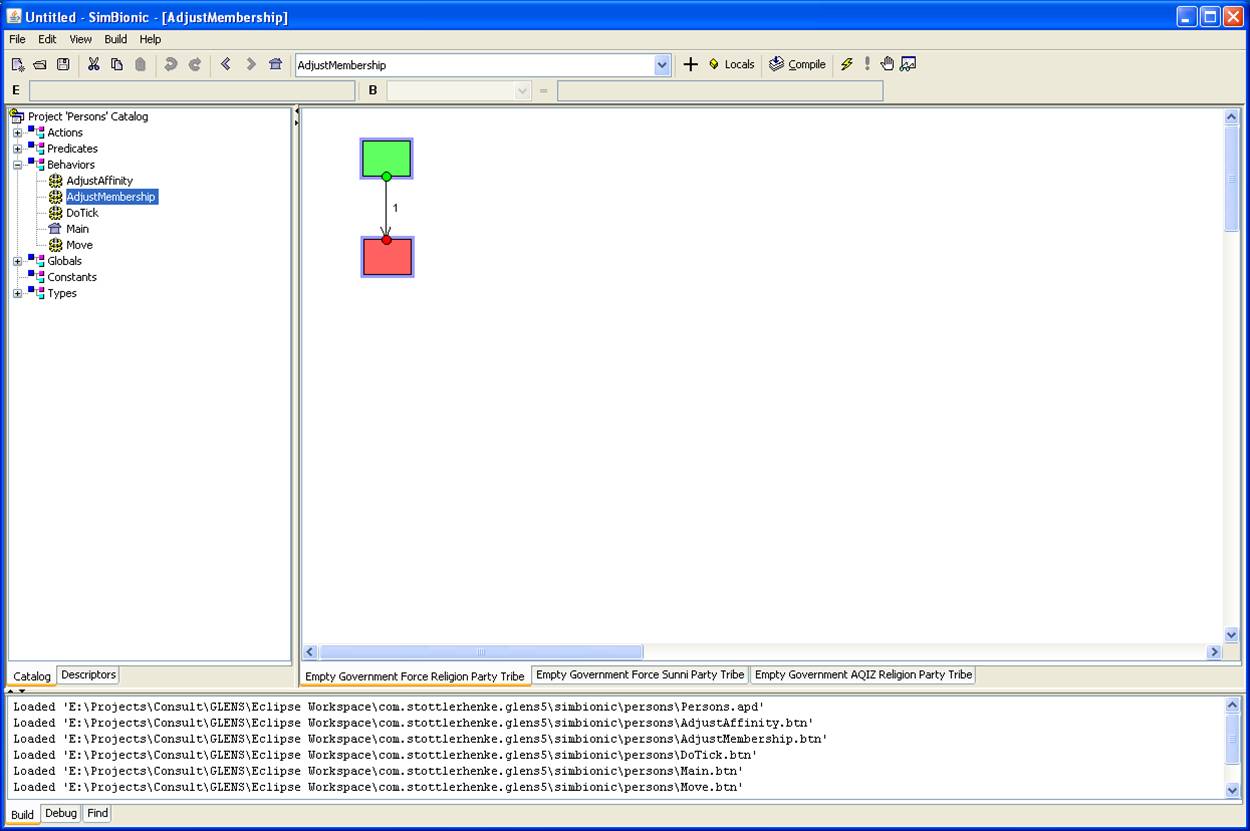
| This is the general case for the
AdjustMembership process. Nothing happens. |
 |
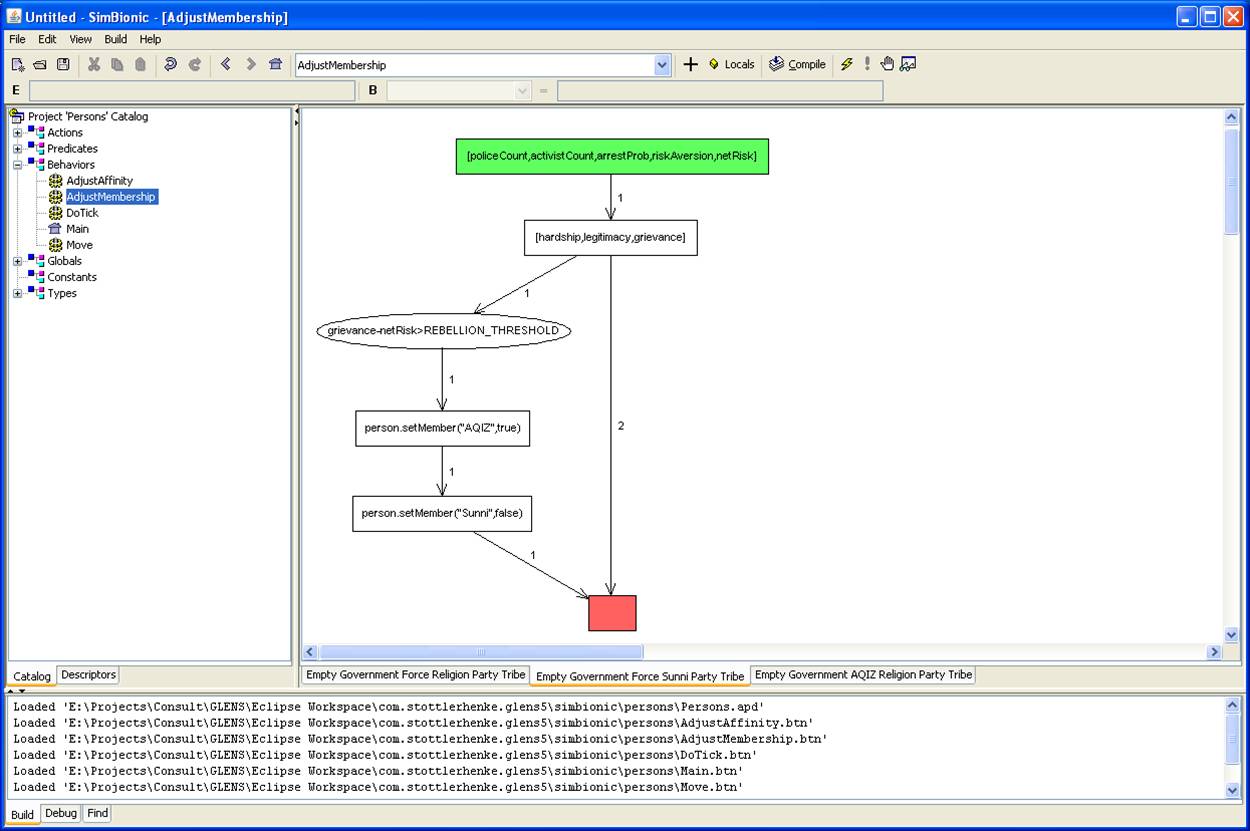
| This is the AdjustMembership process
for Sunni agents. A hardship, legitimacy, grievance value is calculated. First, this value is tested against a threshold. If the threshold is met, the agent is set to be a member of AQIZ and not to be a member of Sunni. Then the process ends. Otherwise, the process ends. |
 |
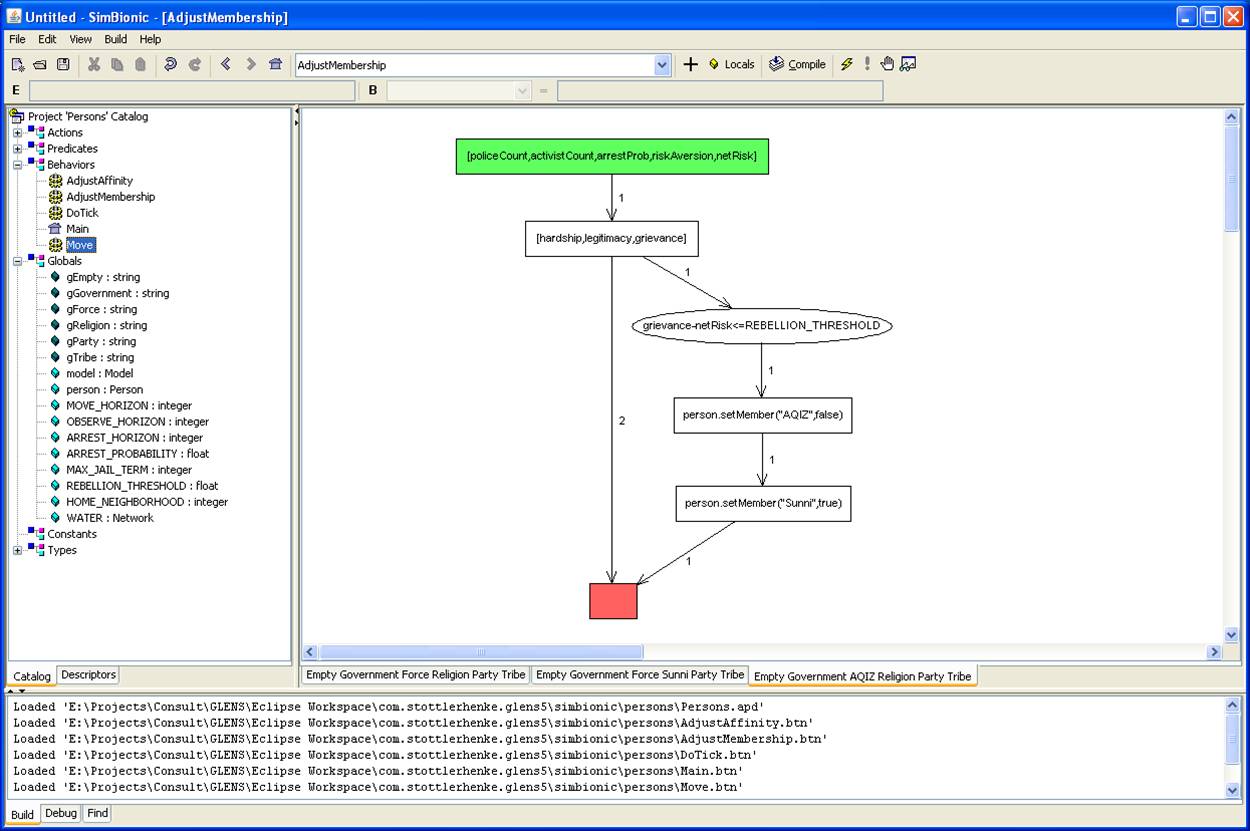
| This is the AdjustMembership process
for AQIZ agents. This mirrors the process for Sunni agents and results either in the agent remaining AQIZ or converting to Sunni. |
 |
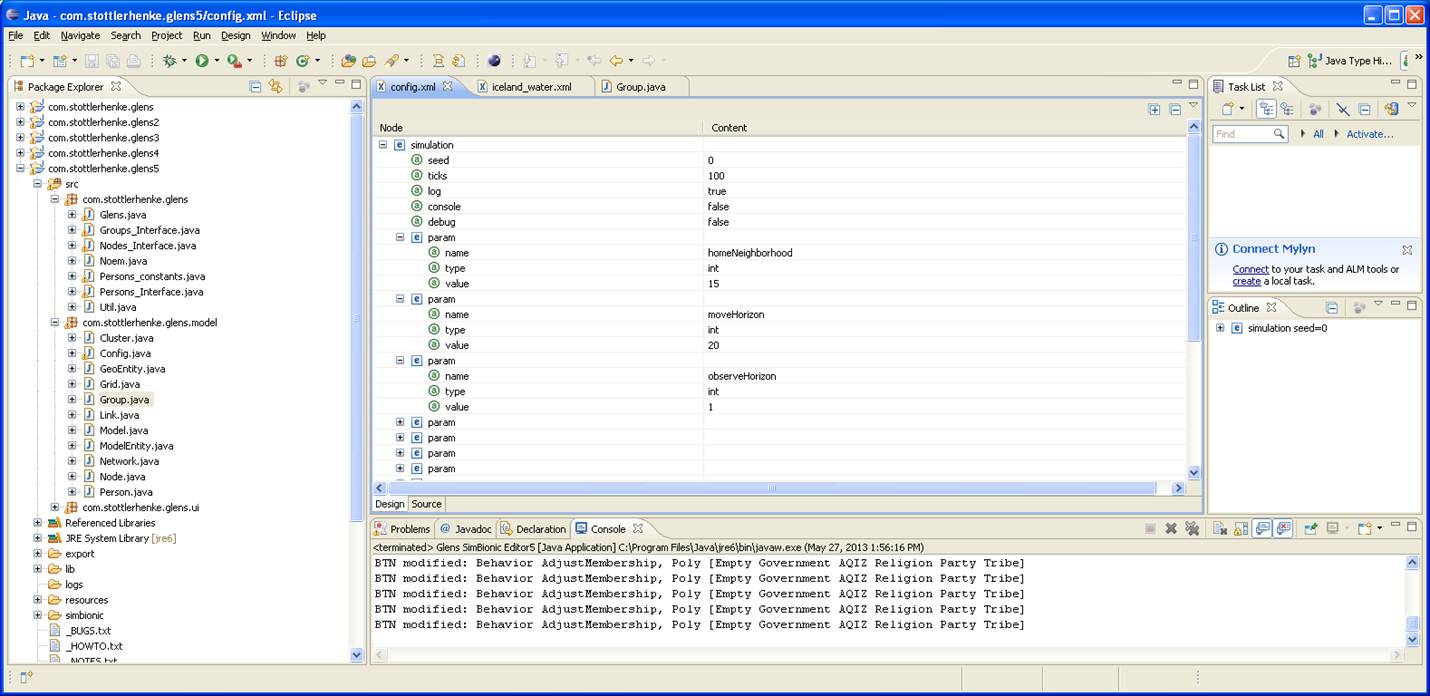
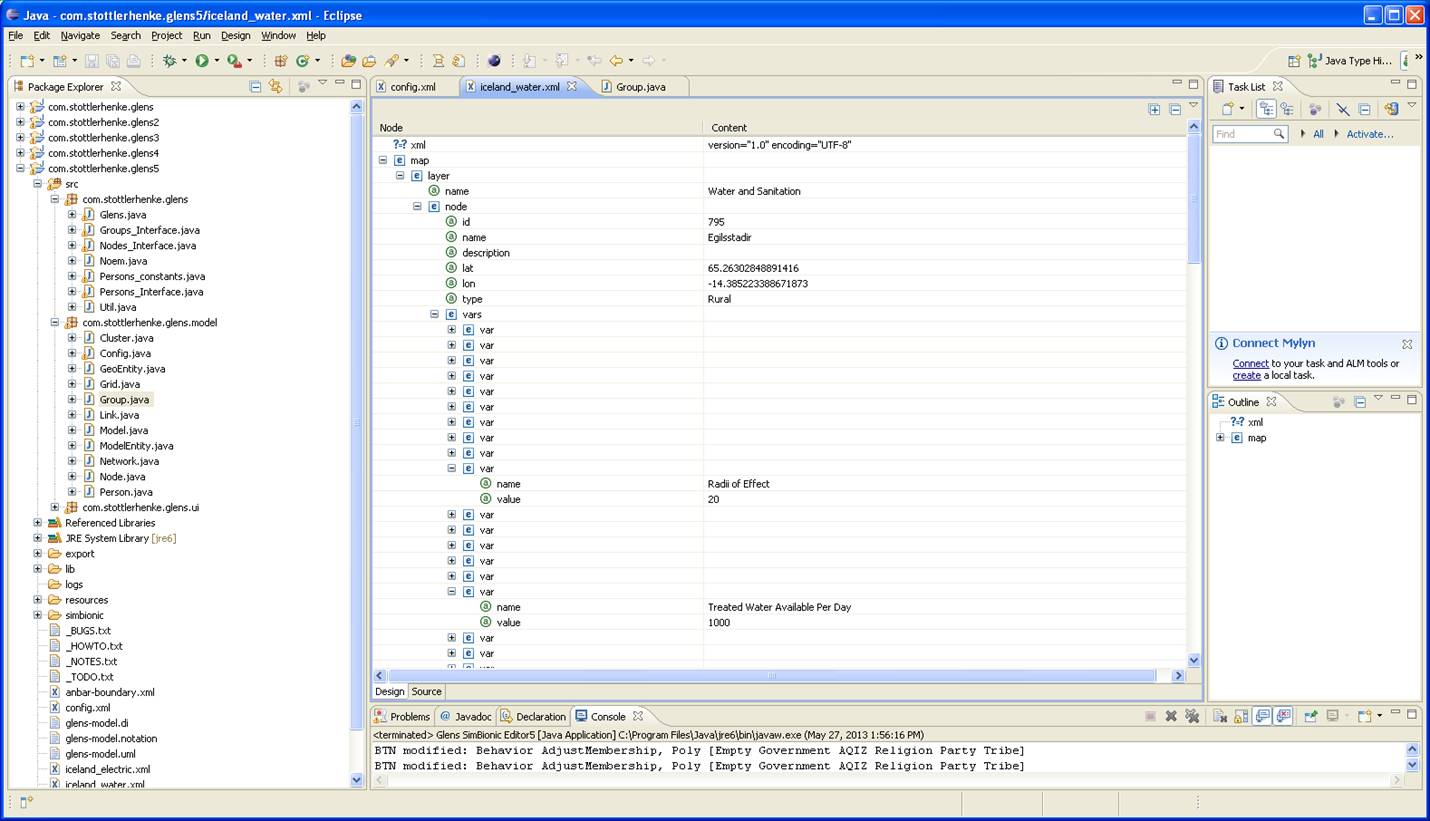
In addition to the SimBionic logic, GLENS also consists of Java code and input files.
| One of the many Java classes is illustrated here. | 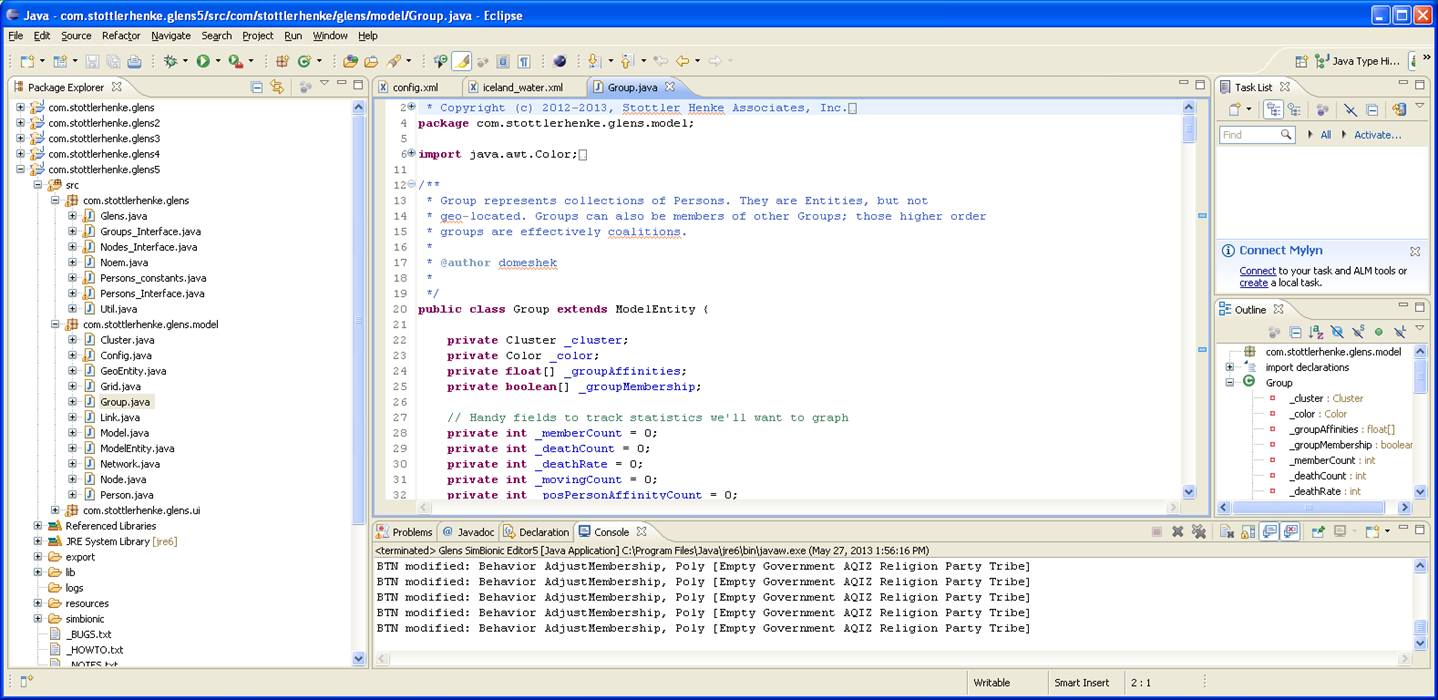 |
| The config.xml file is an XML file that describes the values for the scenario input variables. |
 |
| The iceland_water.xml file is an XML file that describes the water distribution system of Iceland. It includes the names, latitudes and longitudes, and capacities of the water facilities. These capacities were modified for this scenario to induce the migrations in search of new water facilities in the model. |
 |
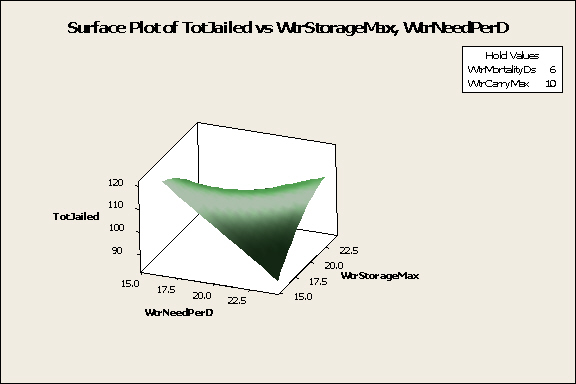
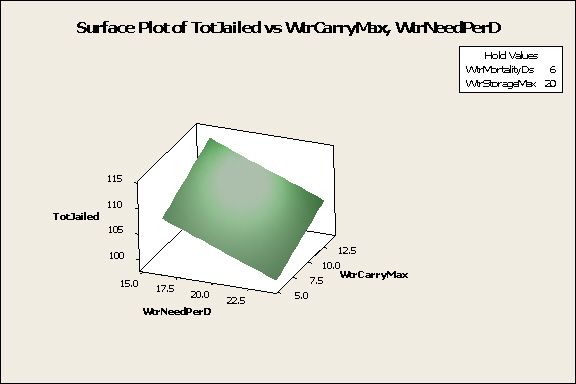
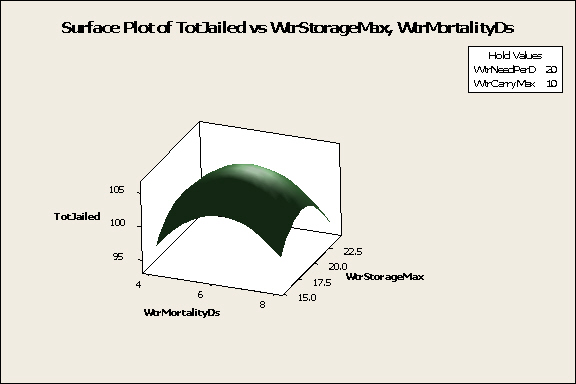
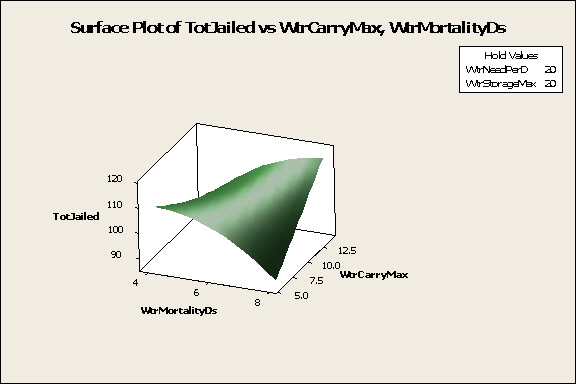
A number of tests were performed to assess the working of GLENS and its integration into NOEM. These tests contributed to the verification and validation of the model.
  |
  |
The GLENS project demonstrated that
Despite the fact that many of the possible interactions were not implemented in this test model, their similarities to the interactions that were implemented indicates that the entire suite of interactions can be implemented.
You can find more information:
(2010). "Three Proof-of-Concept Models Related to Social and Behavioral Modeling of the Anbar Awakening," 2010.
Lindsay, Jon and Austin Long (2009). "Counterinsurgency Theory and the Stabilization of Iraq's Anbar Province," New Haven, Conn.: Paper presented at Yale University's Program on Order, Conflict, and Violence, November 11, 2009; draft available on-line at: http://www.yale.edu/macmillan/ocvprogram/papers/COINAnbar090820.pdf.
Long, Austin, (2008). "The Anbar Awakening," Survival, 50: 2, 67 - 94, 2008. http://dx.doi.org/10.1080/00396330802034283.
Todd, Lin, (2006). Iraq Tribal Study, Global Resources Group, Global Risk, under contract with the Department of Defense.
Few, Captain James M. (2008). "The Break Point: AQIZ Establishes the ISI in Zaganiyah," Small Wars Journal, www.smallwarsjournal.com.
Epstein, J.M., (2002). Modeling civil violence: An agent-based computational approach, PNAS, 99(3), pp. 7243-7250.
Petersen, R. (2001). Resistance and Rebellion. Cambridge University Press.
Salerno, John (2010). The National Operational Environment Model (NOEM), AFRL presentation.
If you arrived here using a keyword shortcut, you may use your browser's "back" key to return to the keyword distribution page.
Return to Hartley's Projects Page