|
The section
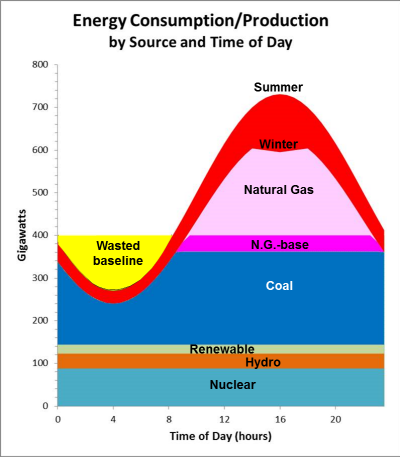
of the figure labeled "Wasted baseline" represents generating capacity that is
not used because the demand is too low. The cumulative gigawatt hours of power
represented by this section comprises the most obvious opportunity for better
management of the energy supply. If this available energy is captured and
stored, then it can be used during the peak hours, reducing the need for the
total capacity during those hours, specifically the capacity generated by
natural gas or coal. On the other hand, there is a strong case for additional
nuclear power for national energy independence and greenhouse gas reduction;
however, the requirement for constant temperature operation would increase the
amount of wasted energy during hours of off-peak demand. Having the very
efficient Sisyphus energy storage solution completely remedies this problem.
Calculating the value of a storage solution in detail is very difficult, as
costs of capital, variability from day to day and season to season, etc., enter
into the math. Further, these details differ over the various parts of the
country. However, the problem of calculating this value becomes easier if the
storage solution involved many local solutions in the same way that the entire
power system involves local generating plants and demand areas. With this
caveat, there is a simple proxy: the hourly cost of power. Power systems
throughout the country have different rates that are charged to major customers
(and in some cases, to residential customers). In general, the rates during
off-peak hours are much lower than during peak hours. The proxy yields a simple
formula: sum the energy price times the "wasted baseline" (at the local level)
to yield a purchase cost. Then, sum the energy price during peak hours times the
recovered energy (purchased energy quantity times the storage system efficiency
factor) to yield a sales price. Subtract the purchase price from the sales
price. As shown in Equation 1, if the result of
these calculations is larger than the storage system cost, then the storage
system saves money (or yields a profit).
 Equation 1. Profit Equation
 |
ENERGY STORAGE
Currently, we are not able to store energy in meaningful quantities.
Figure 2
shows the global stored energy capacity by storage type (described
later). Pumped hydro accounts for more than 99% of this capacity. The
total U.S. electrical generation is about 1100 GW and the U.S. pumped
hydro capacity is about 40 GW. Thus the U.S. energy storage capacity is
only about 3.6% of the total generation capacity.
Figure 3 helps explain this
division. This figure (modified from an EPRI figure) shows the total capacities
of each energy storage type (given the economic sizes of the systems) versus
their discharge times. Certain uses require positioning in different areas of
the figure. Uninterruptible Power Sources (UPS) require very quick discharge
times and (generally) smaller power ratings. Support for load shifting within
the power grid requires medium power ratings and variable discharge times. Bulk
power management (the primary subject of this project) requires large power
ratings and medium to large discharge times. System cost per MW is also a
factor, but Figure 2 and Figure 3
do not address system cost. This will be discussed in the Power Source
Comparisons section.
Pumped hydro relies on the simple physics of potential energy: moving a
mass away from the center of the earth requires energy, which is stored
as potential energy (minus efficiency losses). Returning the mass to a
lower level enables the recovery of this energy and conversion to
electrical energy (minus efficiency losses). In pumped hydro systems,
water is pumped at very high pressure into a much higher storage
reservoir. This requires a large and costly dam with huge pumps. When
the energy is required, the water is allowed to flow down through a
turbine generator to recover the energy. The efficiency of pumped hydro
(recovered energy/input energy) is about 70%.
Compressed Air Energy Storage (CAES) also relies on simple
physics: air is compressed into a chamber and then used to drive a generator to
recover the energy. CAES has at least two major problems. The first is that
compressing air also heats the compressed air. If this heat is lost prior to
recovering the energy this results in an additional efficiency loss. The second
problem is that for large scale uses, the air is compressed into a cavern, which
is inherently dirty. The expanding air that drives the generator carries some of
this dirt into the generating system.
Flywheels are simply very massive wheels. Energy is stored
by spinning the flywheel to higher revolutions per minute and recovered by using
the rotation to drive a generator (reducing the speed). Superconducting Magnetic Energy Storage (SMES) stores
energy as a direct current flow in a superconducting coil. As shown in the
figure, SMES systems are capable of medium power ratings and have extremely
short discharge times. They also have very high efficiency values, generally
greater than 95%. Batteries of various types are also used for energy
storage. Only those that have potential for large scale use are shown in Figure 3. Cost is a major factor
for batteries since the power rating scales linearly with the required number of
batteries. As the required number of batteries increases, the cost does also.
Sisyphus, the subject of this proposal, addresses all of
the foregoing issues and provides superior solutions for the needs of national
and worldwide efficient energy management. This is represented in Figure 3 showing how Sisyphus
systems cover the ideal area for bulk power management. The sections below will
also demonstrate that Sisyphus can achieve these benefits at very favorable
costs.
|
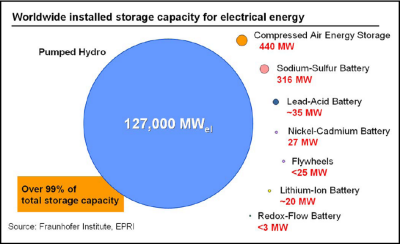
Figure 2. Energy Storage Types
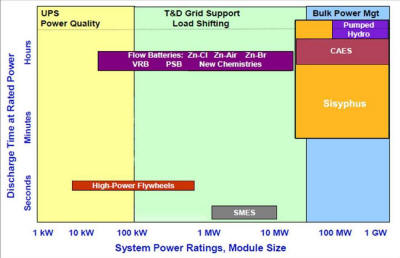
Figure 3. Storage Discharge versus Power
|
SISYPHUS OVERVIEW
The Sisyphus system for energy storage takes its
name from the myth of Sisyphus, who was forced by the Greek gods to roll
a massive boulder up a hill every day, only to have it roll back down
during the night. He had to repeat this process forever. The Sisyphus
energy storage system stores energy by transporting massive blocks
uphill during off-peak hours (night rather than day) and recovers the
energy by their return to the bottom during peak hours (day rather than
night). The picture to the right (Figure 4)
is Titian's painting of the myth, painted from 1548-1549.
The Sisyphus system uses the same basic physics as the pumped hydro systems,
storing electrical energy as potential energy and then converting that potential
energy back into electrical energy. However, there are several important
differences:
- The masses are moved by a solid state linear induction motor and
the energy is recovered using the same solid state equipment as a
linear induction generator, eliminating the need for massive pumps
and generators and their efficiency losses and repair needs.
- The masses are moved by a solid state linear induction motor and the
energy is recovered using the same solid state equipment as a linear
induction generator, eliminating the need for massive pumps and
generators and their efficiency losses and repair needs.
- The masses ride on vehicles supported by
lossless superconducting magnets, eliminating most electrical and
friction-type losses, leading to very high overall efficiency.
- The Sisyphus system is expected to have 90-95%
efficiency, rather than the quoted ~70% efficiency of pumped hydro
(which does not account for the lengthy times when pumped hydro has
been off-line due to equipment repair and replacement of the huge
pumped hydro turbines).
- The Sisyphus vehicles have no physical contact
with the guideway, except though magnetic levitation, eliminating
all frictional wear and tear of the components.
- The rate of energy recovery can be varied simply by
varying the rate of vehicle movement, allowing for more or less rapid
discharge rates when desirable.
- Sisyphus systems can be built economically in
smaller units than is possible for pumped hydro, allowing for
greater flexibility.
- Sisyphus systems can be built in about a third
the time required for a pumped hydro system for lower costs per
equivalent energy storage.
-
Like pumped hydro systems, Sisyphus requires a height differential;
however, it does not require topography suitable for building a
reservoir. In fact, it can be built on the side of any mountain (Figure
5) or in
an underground mine (Figure 6).
Further, like pumped hydro and
unlike
batteries, flywheels and SMES, the scaling cost of Sisyphus depends on
an increase of the low cost elements (concrete blocks), not on the
increase of the high cost elements.
|
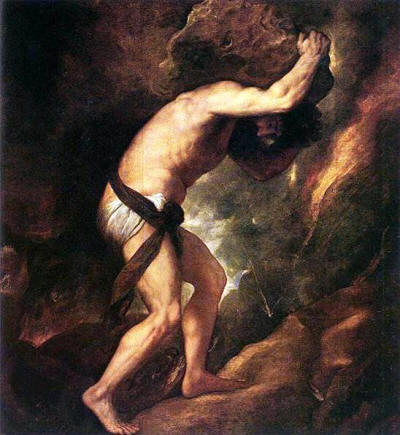
Figure 4. Mythological Sisyphus
|
|
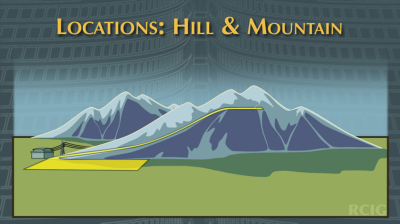
Figure 5. Siting Sisyphus on a Mountain
|
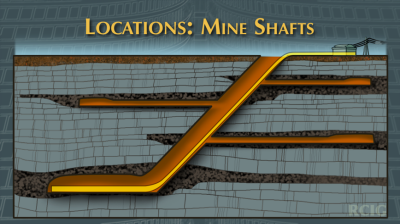
Figure 6. Siting Sisyphus
in a Mine Shaft
|
SISYPHUS TECHNOLOGY
The Sisyphus system for energy storage
embodies several technologies, some simple and some complex.
Operating Technologies
As shown in Figure 7 and
Figure 8, the Sisyphus
system is composed of several parts. There is a storage area at the low end of
the system and a storage area at the upper end of the system. The concrete block
masses are stored in these. There is a guideway connecting the two storage areas
and vehicles that carry the blocks on the guideway, moving them from one storage
area to the other. Not shown are the connections to the power grid, the power
conditioning equipment and the electronic controls.
Figure 7 shows the system
in motor mode. Power is drawn from the grid to move the vehicles carrying the
blocks from the lower storage area to the upper storage area, converting almost
all of the electrical energy into recoverable gravitational potential energy.
Vehicles are loaded from the lower storage area. Loaded vehicles move up the
hill and deposit the blocks in the upper storage area. Empty vehicles move down
the hill to get more blocks. The system is operated in this mode during off-peak
hours when the energy cost is low and proceeds until all of the blocks are moved
up hill.
Figure 8 shows the system
in generator mode. The blocks from the upper storage area are loaded onto
vehicles, which then slide down the hill, converting almost all of the potential
energy into electrical energy. Loaded vehicles deposit the blocks at the lower
storage area and move up the hill to get more blocks. The system is operated in
this mode during peak hours when the energy can be sold at the highest price and
proceeds until all of the blocks are moved down the hill.
|
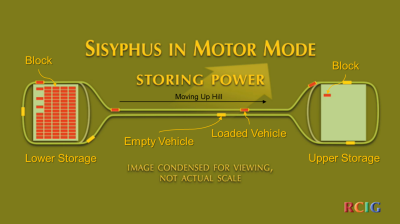
Figure 7. Motor Mode
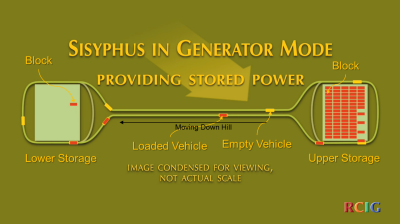
Figure 8. Generator Mode
|
|
The vehicles have rollers on a tilt-able bed supporting the
blocks so that the blocks can be rolled off into the storage areas. The storage
areas have slanted beds of rollers, with brakes, so that the blocks roll toward
the far side and can use gravity to roll the blocks onto the vehicles on the far
side. Figure 9 is an
illustration of one possible configuration of the storage yard subsystem, with
blocks having just been loaded onto four vehicles.
The difference between the purchase price for the electricity and the sales
price for the delivered electricity is the operating profit. The system has
greater than 90% efficiency, meaning that the delivered power is more than 90%
of the purchased power.
A short movie illustrating the Sisyphus operation,
 , click on
the camera symbol. , click on
the camera symbol. |
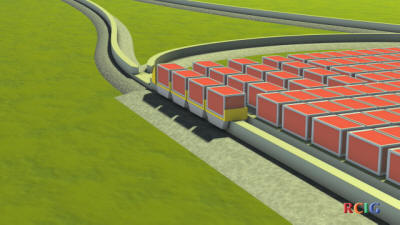
Figure 9. Storage Yard
|
Guideway Technologies
The guideway acts as the non-contact track for the magnetically levitated
vehicles of the Sisyphus system. Each side of the guideway has a set of panels
attached that contain the aluminum coils that comprise the guideway half of the
motor/generator system. The guideway is composed of a series of prefabricated
beams. Each guideway beam is made of polymer concrete, which avoids the need for
rebar strengthening. (Rebar would react magnetically to the moving
superconducting magnets on the levitating vehicles.)
Figure 10
shows a cross-section of the vehicle and the guideway. This view shows the
relationship of the superconducting magnets on the vehicle and the aluminum loop
panels mounted on the sides of the guideway beam. The guideway is shown resting
on grade; however, in certain applications, it could be mounted on pillars in
the same fashion as the Disneyland Monorail.
Figure 11 shows an actual
section of guideway. In the picture, it is sitting on a semi-trailer (you can
just make out three wheel sets at the left end, below the guideway beam. This
and subsequent photographs were taken during a $13 million test project
performed in Florida.
|
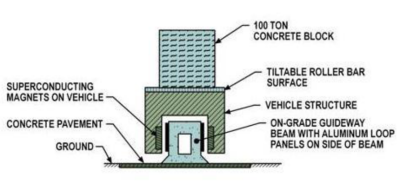
Figure 10. Guideway Cross-section Schematic
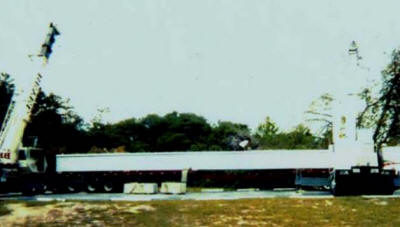
Figure 11. Guideway Beam
|
Motor/Generator Technologies
The levitation/motor/generator
system consists of two components, the superconducting quadrupole component and
the non-superconducting aluminum coils. The quadrupole component contains four
coils of superconducting wire that support an enormous lossless current. As
long as the coils are maintained at the necessary low temperatures, these
currents generate extremely strong magnetic fields. These fields interact with
the aluminum coils, inducing currents and opposing magnetic fields. The magnetic
fields play two roles: levitation and propulsion / power generation effects.
The interactions of these fields create the magnetic levitation effect, keeping
the vehicle several centimeters above the guideway. The levitation may be
supplemented by adding iron plates to the top of the guideway beam.
Figure 12 is a CAD/CAM perspective view of the quadrupole component,
showing the four containment boxes and the cooling connections running between the
pairs. The superconducting coils are in the containment boxes that keep the
loops in a superconducting state and the cooling apparatus that maintains the
temperature of the containment boxes is the long box between them. Looking at
the side, the two loops have currents circulating in opposite directions, so
that the flow where the vertical parts are closest is in the same direction (up
or down) for the two loops.
|
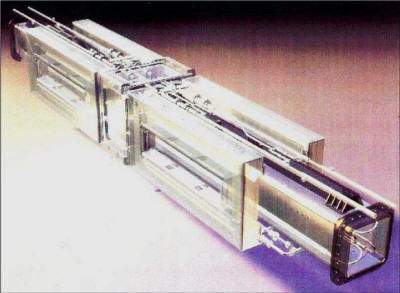
Figure 12. Quadrupole Perspective View
|
Figure 13 is a schematic of the aluminum coils contained in the guideway panels.
-
It shows four sets of paired coils colored blue. These are the vertical
stabilizer coils. They act to raise the quadrupole unit if it drifts too low
and to
lower it if it drifts too high.
This action is generated solely by the induced currents created by the
quadrupole and does not require any external forces or actions (such as
software controls). In addition to gross vehicle movement, these actions
also automatically correct against tilting of the vehicle.
-
Figure 13 also shows four coils colored green. These coils are paired with
the coils on the other side of the guideway and act to shift the quadrupoles
(one on each side of the guideway) to the left or right to retain horizontal
centering.
-
Finally, Figure 13
shows one coil colored red. This is the powered drive coil. Electronic
switching connects it to power only when the quadrupole is present.
Adjoining panels are identical in construction; however, the current
circulates in the opposite direction. The power feed is a sinusoidal
alternating current, so that the direction reverses during each cycle.
-
In the motor mode, power is fed to the coil inducing the impulse to push
the quadrupole in the desired direction. This is accomplished through
the alternating current direction and the opposed circulations in the
quadrupole (Figure 14).
-
In the generator mode, power is drawn from the coil as the quadrupole
moves past it. This slows the quadrupole, maintaining the desired speed,
as the acceleration of gravity acts to increase the speed of the
quadrupole. At the bottom of the hill, the quadrupole is stopped,
drawing the last of the potential energy from the quadrupole, vehicle,
and block.
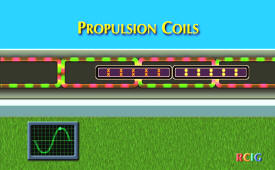
Figure 14. Propulsion Coils
Figure 15 is a photograph of a set of aluminum coils prior to being encased in
polymer concrete to fabricate the panel.
|
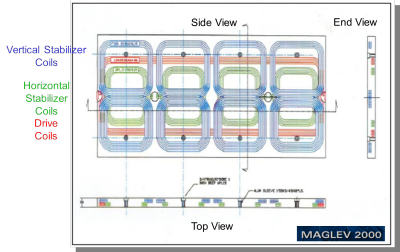
Figure 13. Aluminum Coils Schematic
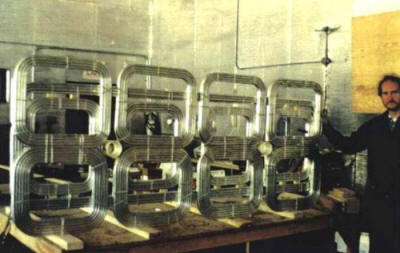
Figure 15. Aluminum Coils Photograph
|
Intellectual Property and Magnetic Levitation Applications
James R. Powell and Gordon T. Danby created and patented a number of inventions
in the field of superconducting magnetic levitation. Powell and Danby presented
their original concepts in 1966 and received a patent in 1968. The original
concept used low temperature superconducting (LTS) magnets (cooled with liquid
helium). In 2000, they were awarded the Benjamin Franklin Medal in Engineering
by the Franklin Institute for their work. Powell and Danby later improved their
concept by using quadrupole superconducting magnets, rather than dipole magnets.
The original quadrupole magnets are also LTS magnets; however, newer designs use
high temperature superconducting (HTS) magnets (cooled with liquid nitrogen).
Relevant patents for Sisyphus are listed in Table 1
below.
Table 1. Intellectual Property Patents
| Title |
Patent Numbers |
Issue Date |
| Electromagnetic induction ground vehicle levitation
guideway |
5511488,
5649489,
5809897 |
April 30, 1996
July 22, 1997
September 22, 1998 |
| Electromagnetic induction suspension and horizontal
switching system for a vehicle on a planar guideway |
5503083,
5655458,
5669310,
5865123 |
April 2, 1996
August 12, 1997
September 23, 1997
February 2, 1999 |
| System and method for magnetic levitation guideway
emplacement on conventional railroad lines installations |
5953996,
6085663 |
September 21, 1999
March 9, 2000 |
| Magnetic levitation system for long distance
delivery of water |
6152045 |
November 28, 2000 |
| Electric power storage and delivery using magnetic
levitation technology |
7191710 |
March 20, 2007 |
Starting in 1969 the Germans built a magnetic levitation transportation
system using non-superconducting magnets. By 1993 they achieved 450 km/hour
speeds. The separation between the vehicle and the guideway must be constantly
monitored and corrected due to the unstable nature of electromagnetic
attraction. The system's inherent instability and the required constant
corrections by outside systems may induce vibration. This system requires very
costly guideways because the magnets are weak (~1 cm gaps) and has no ability
for track switching. This system is in use in Shanghai, China.
Starting in 1972 the Japanese built a magnetic levitation transportation
system using Powell and Danby's original concept. By 1997 they achieved 550
km/hour speeds. Strong magnetic fields (from the dipole superconducting magnets)
on the train require the use of magnetic shielding to protect passengers with
pacemakers and magnetic data storage media such as hard drives and credit cards.
The superconducting magnets do allow greater gaps between the magnets and the
guideway; however, the guideways for this system are very costly. Track
switching is possible, but difficult.
While the Sisyphus system is not designed for passengers, it may use quadrupole
superconducting magnets, which do not require shielding to prevent untoward
effects on nearby systems. Also under investigation is the cost differential
between LTS systems and HTS systems. The HTS wire is currently more expensive
than the LTS wire; however, it is expected that the use of liquid nitrogen
cooling will be much more robust than cooling with liquid helium, which will
provide cost savings in the design. The Sisyphus system supports gaps between
the magnets and the guideway of about 10 centimeters. The quadrupole option
supports high-speed electronic switching. The prefabricated guideway beams are
inexpensive (compared to the Japanese system). |
|
SISYPHUS IMPLEMENTATION
The
implementation can be divided into four parts, the physical definition of the
system, the costs of the system, the projected financial results, and the
implementation phasing.
Physical Definition
Figure 16 shows a view of the
proposed site for the demonstration Sisyphus system. The line between the yellow
pins is the TVA right of way for power line down from the wind farm on top of
Buffalo Mountain. The lower storage yard will be sited at the lower yellow pin.
The upper storage yard will be sited in the flat area below the upper storage
pin.
Figure 17 shows a schematic perspective view of the system, showing
the relative sizes of the storage yards and the guideway linking them.
|
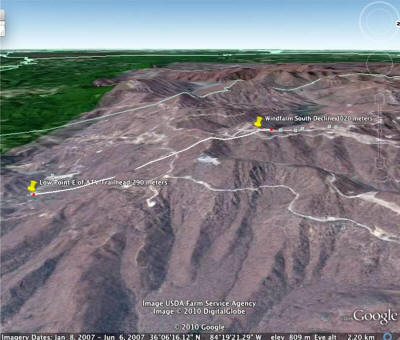
Figure 16. Buffalo Mountain
|
|
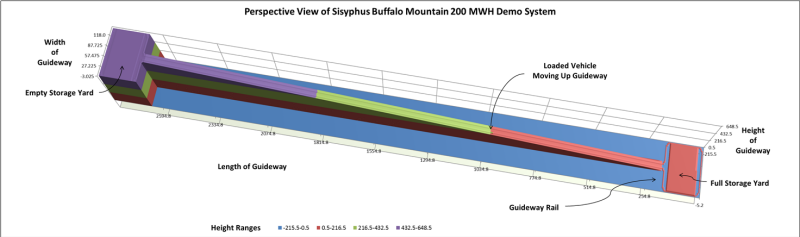
Figure 17. Perspective Schematic of Buffalo Mountain System
|
|
The demonstration Sisyphus system has a nominal energy storage rating of 200
megawatt hours (MWH). That is 200 MWH are stored by the system. With an
efficiency rating of >90%, this means that ~180 MWH will be recovered. The
storage rating is defined by physical parameters of system height (640 m),
weight per block (100 metric tons), and number of blocks moved (1148). The
potential energy stored in one 100 metric ton block raised 640 m is 0.1742 MWH.
Lifting 1148 blocks stores 200 MWH.
Keeping 1148 blocks alternately at the foot of the grade and the top of the
grade requires two storage yards of ~3.2 acres, each. The layout also requires
~6300 m of guideway. Vehicles will move at ~60 miles per hour between the
storage yards. Higher speeds are easily possible; however, efficiency losses
from increased wind drag reduce the value of higher speeds. It will take the
vehicles 14 seconds to reach 60 mph and 14 seconds to decelerate. With an
estimated 50 seconds to load a block and 50 seconds to unload it, the total
round trip time is about 4 minutes. In order to lift all 1148 blocks during the
off-peak hours, 12 vehicles are required ((4 min x 1148 blocks / 12 vehicles) /
60 min/hour = 6.4 hours). Because the peak time is longer than 6.4 hours, the
rate of energy recovery can be varied from rapid to slow, depending on needs.
In addition to the vehicles, guideway, and blocks, the storage areas will need
handling equipment and the entire system requires electrical control and power
conditioning subsystems. This Sisyphus system requires no investment in land, as
the TVA right of way is sufficient to contain the system.
Upon the successful completion of the demonstration system, the entire system
can be upgraded to a nominal 1000 MWH of storage. This five-fold increase in
storage requires five times as many blocks (5740) and 7 1/3 times as much block
storage (23.5 acres per storage yard) [to minimize guideway changes]. However,
it only requires 3 1/3 times as many vehicles (40), which comprise the most
expensive part of the system, and 1 1/4 times as much guideway (~8020 m) [to
account for the increased storage area], which is a moderately expensive part of
the system.
|
System Costs
The system costs are divided into investment
costs to build the system and annual costs for its operation, as shown in Table
2. The total investment cost of $60 million is based on current best estimates
of costs of the various components of the system. This figure also shows up as a
30 year straight-line amortization in the annual costs. The cost of purchased
energy is based on an estimate of 8 cents per KWH ($80/MWH) for energy purchased
off-peak.
Table 2. Demonstration System Costs
| Cost Element |
Cost ($M) |
$/MWH Delivered |
Cents/KWH Delivered |
| Investment in Land |
0.0 |
|
|
| Investment in Guideway |
10.0 |
|
|
| Investment in Electrical Subsystems |
2.5 |
|
|
| Investment in Storage Yards |
1.2 |
|
|
| Investment in Vehicles |
24.0 |
|
|
| Investment in Blocks |
4.0 |
|
|
| Total Investment |
59.7 |
|
|
| |
|
|
|
| Annual Operations & Maintenance |
3.0 |
45.4 |
4.5 |
| Annual Purchased Energy |
5.8 |
88.9 |
3.0 |
| Annual Depreciation |
1.9 |
28.3 |
2.8 |
| Annual Interest Payments |
2.1 |
31.8 |
3.2 |
| Annual Royalty Payments |
0.1 |
2.0 |
0.2 |
| Total Annual Costs |
12.9 |
196.4 |
19.6 |
These cost estimates are based on the assumption of multi-unit production.
The first Sisyphus system will incur additional setup costs, which are described
in the implementation phasing section below.
|
|
Projected Financial Results
The financial results are divided
into gross revenue (delivered energy times price), net revenue (gross revenue
minus energy purchase costs and operations & maintenance costs), and profit (net
revenue minus amortization costs), as shown in Table 3. The price of energy sold
is based on an estimate of 20 cents per KWH ($200/MWH) for energy sold at peak
prices. The quantity of energy delivered is 90% of the quantity purchased. The
Return on Investment (ROI) is the Net Revenue as a percent of Total Investment.
Table 3. Projected Demonstration System Financial
Results
| Cost Element |
Cost ($M) |
$/MWH Delivered |
Cents/KWH Delivered |
| Gross Revenue |
13.1 |
200.0 |
20.0 |
| Net Revenue |
4.3 |
|
|
| Profit |
0.2 |
3.6 |
0.4 |
| |
|
|
|
| ROI |
7.2% |
|
|
|
|
1000 MWH Upgraded System Financials
The financial results for
the upgraded system are shown in the same formats as for the demonstration
system (Table 4 and Table 5). Note that the Investment figures are totals for building this system and
include the costs for the demonstration system. The increase in profitability is
due to the efficiency of scale, as the energy costs and sales come to dominate
the other costs.
Table 4. 1000 MWH System Costs
| Cost Element |
Cost ($M) |
$/MWH Delivered |
Cents/KWH Delivered |
| Investment in Land |
0.0 |
|
|
| Investiment in Guideway |
12.7 |
|
|
| Investment in Electrical Subsystems |
10.6 |
|
|
| Investment in Storage Yards |
8.7 |
|
|
| Investment in Vehicles |
80.0 |
|
|
| Investment in Blocks |
20.0 |
|
|
| Total Investment |
163.3 |
|
|
| |
|
|
|
| Annual Operations & Maintenance |
8.2 |
24.9 |
2.5 |
| Annual Purchased Energy |
29.2 |
88.9 |
8.9 |
| Annual Depreciation |
4.8 |
14.5 |
1.5 |
| Annual Interest Payments |
5.7 |
17.4 |
1.7 |
| Annual Royalty Payments |
0.7 |
2.0 |
0.2 |
| Total Annual Costs |
48.5 |
147.7 |
14.8 |
Table 5. Projected 1000 MWH System Financial Results
| Cost Element |
Cost ($M) |
$/MWH Delivered |
Cents/KWH Delivered |
| Gross Revenue |
65.7 |
200.0 |
20.0 |
| Net Revenue |
28.3 |
|
|
| Profit |
17.2 |
52.3 |
5.2 |
| |
|
|
|
| ROI |
17.3% |
|
|
|
|
Implementation Phasing
The creation of the first Sisyphus
system, the demonstration system on Buffalo Mountain, TN, requires additional
setup costs. These setup costs involve creating engineering drawings and tooling
and extensive testing to establish the workability of the concepts and refine
the costs. Workability will be defined by the Technology Readiness Level (TRL)
metrics.
The work will proceed in six phases, as shown in Table 6.
Each phase has short definition and a goal describing what will be achieved
during the phase. For each phase of the demonstration system, the estimated
labor and material costs are shown, along with the total cost for the phase and
the phase duration. The totals for all phases of the demonstration system are
also shown. The estimated total cost and time to upgrade the system to the 1000
MWH Sisyphus system are shown as Phase 5.
Table 6. Sisyphus Phases
| Phase |
Definition |
Goal |
Labor Costs ($M) |
Material Costs ($M) |
Total Costs ($M) |
Duration |
| 0 |
Order high temperature wire |
Negotiate price and order high temperature wire. Configure working
areas for later phases. Refurbish low temperature modules for
demonstrations. Perform preliminary engineering. |
1.0 |
1.3 |
2.3 |
9 months |
| 1 |
Production-scale component design and
test |
Establish operating parameters for load-bearing magnets and guideway
(calibrate tons/magnet). Engineer the magnet modules. Includes
production of two full-sized lift modules and a full-sized guideway
section. |
1.1 |
0.5 |
1.6 |
12 months |
| 2 |
Full vehicle test |
Statically lift 100 ton block and measure reliability/performance
parameters. Establish Maglev 2000 TRL 4. Construct short (~100
meters) angled guideway section, with power generation components.
Lift block with vehicle; load block onto vehicle from storage yard;
and unload block from vehicle to storage yard. Establish Sisyphus
TRL 4. |
0.9 |
6.7 |
7.6 |
12 months |
| 3 |
Full-scale mini-system |
Produce a full-scale, working
mini-system: two vehicles and 200m of guideway on an incline, half
of which is power generating. Establish Sisyphus TRL 5. |
0.7 |
8.1 |
8.8 |
12 months |
| 4 |
200 MWH Demo System |
Produce a small production system.
Establish Sisyphus TRL 6. |
4.1 |
62.6 |
66.7 |
12 months |
| |
Total Demo |
|
7.8 |
79.2 |
87.9 |
4.75 years |
| |
|
|
|
|
|
|
| 5 |
1000 MWH System |
Produce a full size production system.
Establish Sisyphus TRL 9. |
7.2 |
98.2 |
105.4 |
12 months |
| |
Grand Total |
|
15.0 |
177.4 |
192.4 |
5.75 years |
|
|
POWER SOURCE COMPARISONS
Table 7, below, compares
the costs of electrical energy among several options. The numbers in the table
must be regarded as approximate for several reasons. First, actual power plants
are based at a particular location, have a particular design, and are built at a
particular time. Therefore, their actual costs are unique. The numbers in the
table are “average” numbers, where the proper weightings to produce the averages
are debatable. Second, the numbers are derived from several sources and may
contain hidden assumptions that differ among the sources. Third, each type of
power source has its own constraints, making comparisons difficult. For
example, hydro-electric plants must be built on rivers with particular
characteristics and all or almost all of those situations may have already been
used. Fourth, some numbers are estimates, with unknown accuracy values. This
is particularly true of the Sisyphus numbers and the O&M costs for pumped hydro
storage. Nevertheless, the table gives a clear overview of the situation, as
long as there is unused energy available for storage, building and using a
Sisyphus system is less expensive than building a new power generating system of
any type, except perhaps hydro-electric. It is also less expensive as a
replacement power source (comparing operating expenses) than any source other
than hydro-electric.
Table 7. Comparison of Power Source Costs in $/MWH
|
Type |
O&M |
Fuel |
Subtotal |
Capital Cost/ Delivered MWH |
30 yr Ammor-tization |
Total |
Other Estimate |
|
Fossil Steam |
8.86 |
28.34 |
37.20 |
1441.90 |
48.06 |
85.26 |
121.50 |
|
Gas Turbine |
5.22 |
30.45 |
35.67 |
304.27 |
10.14 |
45.81 |
85.05 |
|
Hydro-electric |
11.34 |
0.00 |
11.34 |
364.30 |
12.14 |
23.48 |
84.50 |
|
Nuclear |
19.81 |
7.61 |
27.42 |
1933.16 |
64.44 |
91.86 |
96.10 |
|
Pumped Hydro Storage |
43.12 |
0.00 |
43.12 |
862.36 |
28.75 |
71.87 |
|
|
Sisyphus (1000 MWH) |
24.86 |
0.00 |
24.86 |
497.18 |
16.57 |
41.43 |
|
The sources for the O&M, Fuel, and Capital Costs are from US Energy
Information Administration (EIA) 2012 reports, with the Capital Cost/Delivered
MWH calculated using EIA efficiency values. The Pumped Hydro Storage O&M costs,
however, are calculated as 5% of the total Capital Costs for the system, using
the same percentage as is used for the Sisyphus estimate. The Sisyphus numbers
come from the estimates shown above. The Other Estimate values come from a
Wikipedia
article on levelized costs in 2012 dollars of electricity by source. The
differences in these estimates for Fossil Steam, Hydro-electric, and Nuclear lie
in the estimates of capital costs, while the difference for Gas Turbine come
from both capital costs and O&M plus Fuel costs. It should be noted that both
Hydro-electric and Pumped Hydro Storage have severe location constraints and
that both Pumped Hydro Storage and Sisyphus assume that there is excess power to
be stored, as neither actually generate new power.
ADDITIONAL IMPLICATIONS OF SISYPHUS
The use of Sisyphus systems has two additional major implications: enhanced
grid security and support for rapid local load balancing.
Grid Security
Sisyphus systems are capable of storing commercially significant amounts of
power. The 1000 MWH upgraded system described here moves fewer than 6000 blocks
up 640 m, requires about 50 acres of land, and costs less than $200 million.
There are untold numbers of sites in the U.S. that can accommodate such a
system. Sites with larger elevation differences and those using more blocks can
store more power. A great number of these sites will be found near power
generation sites, meaning that the local area will be less dependent on grid
stabilization from out of the local area.
Currently, the U.S. is divided into 3 major power grid sectors and numerous
subsectors. However, even the subsectors are quite large. The interconnections
are built to limit blackouts from affecting too many other areas; however, the
2003 Northeast blackout affected about 45 million people in the US and 10
million people in Canada. Sisyphus will enable smaller sectors to handle
problems, preventing large scale blackouts, whether caused by natural disasters
or by cyber attacks.
Rapid
Load Balancing
In the physical description of Sisyphus above, the top speed of the vehicles was
set at 60 mph and the trip time to load a block, travel to the other storage
yard, and unload a block was calculated as 4 minutes. This resulted in a
minimum time to move all the blocks from one storage yard to the other of 6.4
hours (for the 200 MWH demonstration system). Given 90% efficiency, 180 MWH
would be recovered in 6.4 hours, yielding an average power rating of ~28
megawatts. However, some local situations might require more power for load
balancing. Increasing the vehicle speeds would yield lower trip times and
produce more power; however, the power peaks at 90 mph and decreases after that
due to the ratio of acceleration time and time traveling at maximum speed.
These calculations assume constant efficiency, but efficiency will decrease with
increasing speed due to wind resistance. Even without wind resistance increase,
the amount of power increase from 60 to 90 mph is only about 4%.
Increasing vehicle frequencies will also yield more power. The 6.4 hour time
assumes that subsequent vehicles start loading about 20 seconds after the
previous vehicle starts loading. The 12 vehicles could be set to start loading
about 10 seconds after the previous vehicle started, giving a 60% increase in
power during the time for the 12 vehicles to descend; however, the vehicles
would have to return to the top, with no power being recovered during the
interim. Figure 27 graphs
the power (green curve) generated by 12 vehicles for different separation times
(measured on the left axis). It also shows the lag time (bent straight line)
before the first vehicle (calculated as the 13th vehicle) can start
generating power again. As the separation time is reduced to about 20 seconds,
this curve (measured on the right axis) drops because the only gaps between
vehicles are the separation times. However, separation times less than 20
seconds require that the available 12 vehicles bunch up, leaving larger and
larger gaps between the bunch of 12 vehicles.
The implication of these calculations is that Sisyphus can generate bursts of
power over short time frames. However, such a burst of power must be paid for
with a delay until more power can be produced. As shown in Figure 27, with all 12 vehicles running in a
single bunch (zero seconds separation), the maximum power is generated at a cost
of maximum recovery time (240 seconds = 4 minutes) |
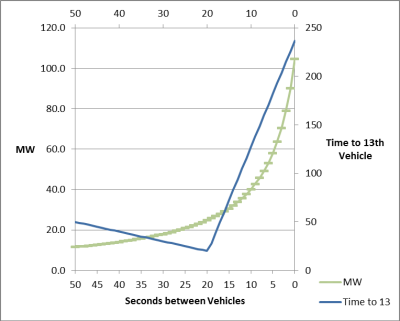
Figure 27. Power and Time to the 13th Vehicle Depend on Vehicle
Separation
|
CONCLUSIONS
As the U.S. moves away from fossil fuel generated electrical energy, the need
to store energy during off-peak periods for use during peak periods will
increase. Done properly, storing this energy does not increase the overall cost
of energy, rather it enables cost savings.
Sisyphus is a system for storing and recovering electrical energy. Sisyphus
stores the energy by moving massive blocks from a low point to a high point,
converting the electrical energy into potential energy. It recovers the energy
by moving the blocks from the high point to the low point, converting the
potential energy back into electrical energy. Because it uses superconducting
magnets to move the blocks, it has an efficiency of greater than 90%. To store
more energy, Sisyphus only needs to move more blocks, which are inexpensive.
This means that it scales well, costing less per megawatt hour (MWH) stored as
the system size increases. Sisyphus systems can be built anywhere that has a
significant height differential (>600 m), with slopes from 25% grade to vertical
(including mine shafts). That means that Sisyphus systems can be built almost
anywhere in the U.S. and will deliver locally useful amounts of stored energy
(1000 MWH and up).
Sisyphus systems can be built at a lower cost than creating new power plants
or running existing power plants for peak-demand use. Fossil fuel plants that
generate greenhouse gases can be phased out without worrying about the problem
of varying electric power demands. Alternative power sources, such as wind and
solar that do not supply constant power, will generate power when feasible for
use when needed.
Because the Sisyphus system supports variable energy recovery rates, it can
surge its energy recovery to support rapid local load balancing. In addition,
Sisyphus’ local energy storage will support smaller grid segmentation, which
will make the power grid much more secure against failures and hostile attacks.
The Sisyphus concept is a transformative improvement of an earlier generation
American magnetic levitation technology that is in commercial development in
Japan. The patented improvements have been tested at the component level and
will be tested at the system level during the project to build a 200 MWH
demonstration system. This system developed by this proposal will then be
upgraded to a commercial 1000 MWH system.
Sisyphus is the solution to these acute
problems, providing a vital missing element in the national and international
quest for higher energy efficiency, greater security and lower greenhouse gas
emissions.
If you arrived here using a keyword shortcut, you may use your
browser's "back" key to return to the keyword
distribution page.
 Return to Hartley's Projects Page