Page
Last Updated:
Tuesday, 19 January 2016 11:02 EDT, © 2007, 2008, 2012, 2016
PROJECT: DARPA COMPOEX VV&A
Dr. Dean S. Hartley III
| Project Metadata |
Keywords |
|
Label |
Name |
Other |
Year |
DurationYrs |
|
Client |
Defense
Advanced Research Projects Office (DARPA) |
Office of
the Secretary of Defense (OSD) |
|
|
|
Dates |
|
|
2007 |
0.5 |
|
Employer |
Hartley
Consulting |
|
|
|
|
Partner |
Evidence
Based Research (EBR) |
|
|
|
|
Pubs |
Verification, Validation, and Accreditation (VV&A),
Evidence Based Research |
co-author |
2007 |
|
|
Team |
Robert D.
Clemence, Jimmie McEver, David F. Noble, Albert A. Sciarretta,
David Signori, Stuart Starr, Laura K. Whitney |
|
|
Configuration management |
|
Consequence Management |
|
Data Verification & Validation |
|
Database design |
|
DIME/PMESII Modeling |
|
Geopolitical analysis |
|
Global War on Terrorism (GWOT) |
|
Human factors |
|
Human, Social, Cultural Behavior (HSCB) Modeling |
|
Impact analysis |
|
Independent Verification & Validation (IV&V) |
|
Irregular Warfare (IW) |
|
Metadata |
|
Modeling, Simulation & Gaming (MSG) |
|
Network analyses |
|
Operations Other Than War (OOTW) |
|
Risk analysis |
|
Software issues |
|
Software reuse |
|
Stability Operations (SASO, SSTR) |
|
Verification, Validation & Accreditation (VV&A) |
|
Warfare modeling |
|
Challenge:
Create a VV&A methodology for DARPA for the Conflict Modeling, Planning and
Outcome Experimentation (COMPOEX) Program. COMPOEX is a large political,
military, economic, social, information, and infrastructure (PMESII) simulation.
- Simulations used to model operations where PMESII factors are relevant
stretch the boundaries of scientific knowledge.
- Consequently verifying, validating and accrediting (VV&A) are difficult
tasks.
- Actual VV&A of PMESII models have been few and shallow.
- Flexible Asymmetric Simulation Technologies (FAST) Toolbox
- Citations
- Hartley, Dean S., III (2004). FAST for the Warfighter: Test Strategy
& Plan (Revision 3). DRC, Vienna, VA.
- Hartley, Dean S., III (2005). MOOTW FAST Prototype Toolbox: FY04
Validation Strategy & Plan. DRC, Vienna, VA.
- Hartley, Dean S., III (2005). MOOTW FAST Prototype Toolbox: FY05
Validation Strategy & Plan. DRC, Vienna, VA.
- Senko, Robert M. (2005). Flexible Asymmetric Simulation Technologies
(FAST) for the Warfighter: FY05 Final Verification Test Report. DRC,
Vienna, VA.
- Analysis: broad but shallow
- Synthetic Environment for Analysis and Simulation (SEAS)
- Citations
- Chaturvedi, Alok R. (2003). “SEAS-UV 2004: The Theoretical Foundation of
a Comprehensive PMESII/DIME Agent-Based Synthetic Environment,” Simulex,
Inc.
- McDonald, C. S. (2006). Verification and Validation Report for the
Synthetic Environment for Analysis and Simulation (SEAS). The Johns
Hopkins University – Applied Physics Laboratory, Laurel, MD.
- Sheldon, Bob (2006). “Memorandum for the Record: V&V Report for the
Synthetic Environment for Analysis and Simulation (SEAS), 27 October 2006.”
- Analysis: narrow and shallow
- Conflict Modeling, Planning and Outcome Experimentation (COMPOEX)
Program
- Citations Davis, D. F. (2006). “Consolidated Report Consisting of three
Research and Development Project Summary Reports,” Contract
#W15P7T-06-T-P238. Peace Operations Policy Program, George Mason University,
Arlington, VA.
- Analysis: very narrow (elements analyzed not included in COMPOEX) and
medium depth (not all needed parts were available)
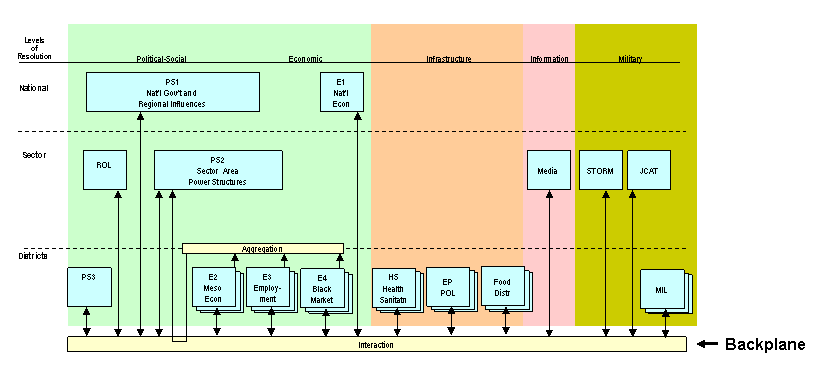
The figure below illustrates the complexity of COMPOEX.
Each PMESII area is represented by a set of models,
divided by level of resolution. In general, the models communicate with each
other by posting variable results to the backplane at the end of each time
step and reading variable values at the beginning of the next time step.
From a V&V perspective, each model must be addressed and
the nature of the assumptions built into the communications links must be
addressed as part of the V&V of the entire system. The fact of multiple
simulation paradigms used within the system (systems dynamics models, SOAR
technology, and possible other agent-based modeling systems) complicates the
process.
However, the most challenging aspect from a VV&A
perspective is the proposed use of different sets of models, depending on
the situation, with models being custom built or modified immediately prior
to use.
Project Team:
The team was composed under the Evidence Based Research (EBR)
corporate umbrella, as follows.
-
Stuart Starr, Project Lead
-
Dean Hartley, Hartley Consulting
-
Al Sciarretta, CNS Technologies
-
EBR
-
Robert Clemence
-
Joseph Lewis
-
Jimmie McEver
-
David Noble
-
David Signori
-
Laura Whitney
Accomplishment:
Identified and defined five critical elements
Risk-Based VV&A
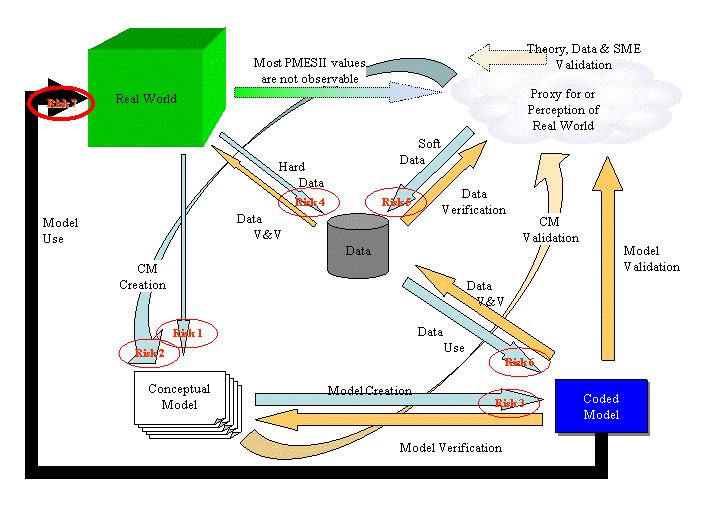
The figure below illustrates the elements of the modeling and
V&V processes. Each of the model building and using processes involves a risk.
The V&V processes permit the identification and correction of errors, reducing
risk.
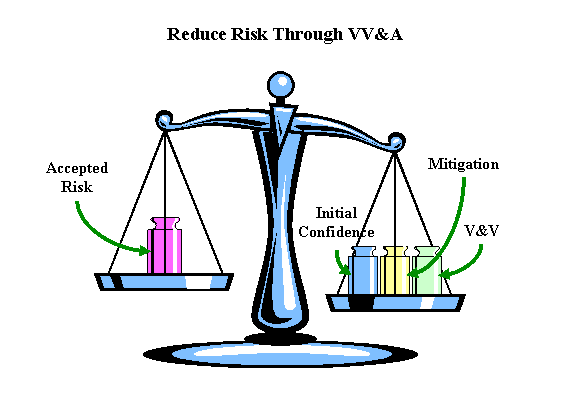
The V&V processes generally identify problems that cannot be
simply corrected. However, these problems can often be mitigated, further
reducing risk. Because no V&V of a major model will be complete, a portion of
the decision concerning the use of the model will involve some level of trust,
indicated in the figure below as "Initial Confidence." Finally, after all
corrections and mitigations have been carried out, there will remain some level
of risk. The accreditation decision is based on the comparison of the
residual risk and the collective confidence built by the V&V concerning the use
to which the model will be put. If the accreditation decision is positive,
then the residual risk still exists, but is now termed "accepted risk."
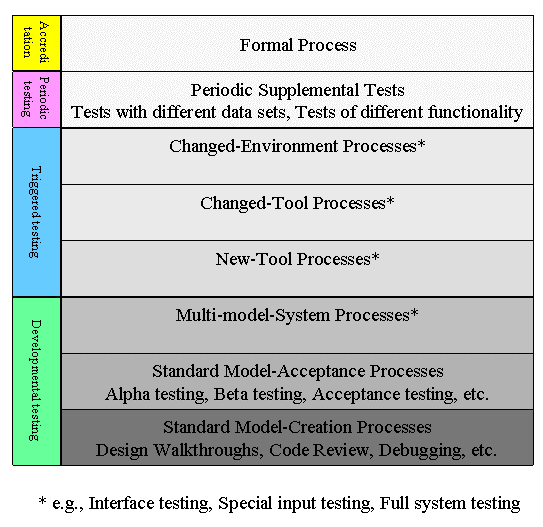
Entrenched VV&A
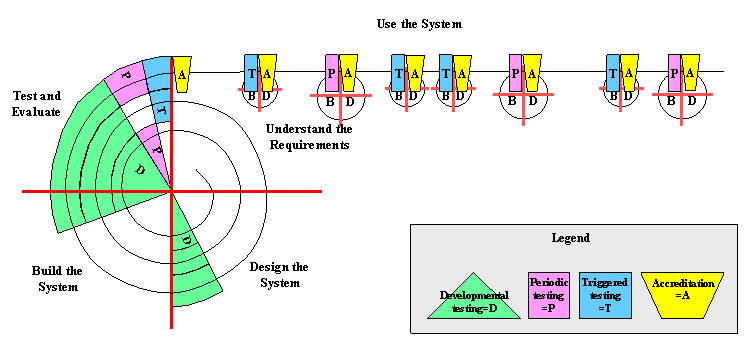
Testing is divided into developmental testing, triggered
testing, and periodic testing and is followed by accreditation, as defined in
the following figure. The actual tests are of varying types and are adequately
described in the V&V literature.
All tools go through developmental testing
- Those created for the toolset undergo creation testing
- New models, whether purpose created or brought in from outside,
undergo acceptance testing
- All tools undergo multi-tool system testing
Certain events trigger additional testing
- A new tool being brought into the toolset triggers the new-tool
process
- A proposed change to an existing tool (new sub-model, etc.)
triggers the changed-tool process
- Changes to the system being modeled require model changes
Periodically supplemental tests are performed to increase the
understanding of the toolset
- Tests with new data sets
- Tests of functionality that was previously rated as lower
priority
- Etc.
Accreditation
- Follows end of development
- Follows each triggered test
- Follows each periodic test
|
 |
The various types of testing and the accreditation processes occur at
specific times during the lifecycle of the model, as shown in the following
figure.
- Developmental testing includes V&V of conceptual models and
debugging during the Build phase
- The Periodic testing in this figure presumes a two cycle per
year spiral process
- The Triggered testing actually has no specific time relation –
the events are placed to suggest this
- Accreditation is similarly event-based, not time-based,
following each periodic and triggered testing event
|
 |
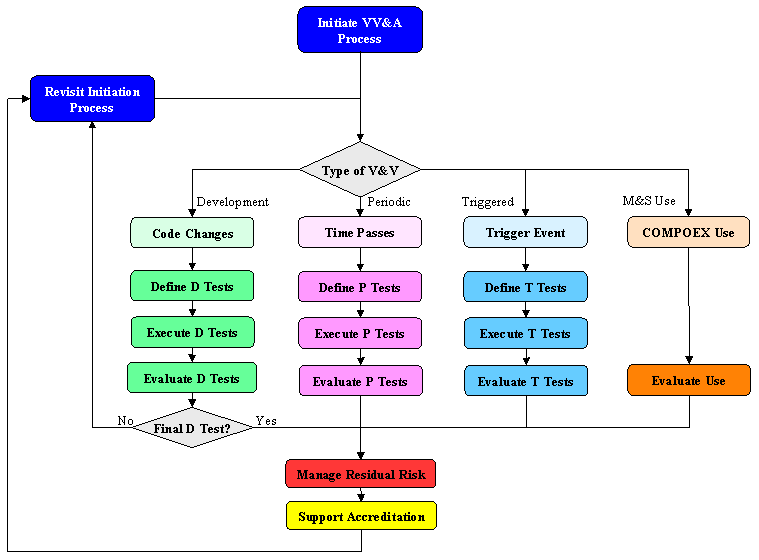
The parts of the VV&A methodology can be illustrated in a flow diagram, as
shown below.
V&V Metrics
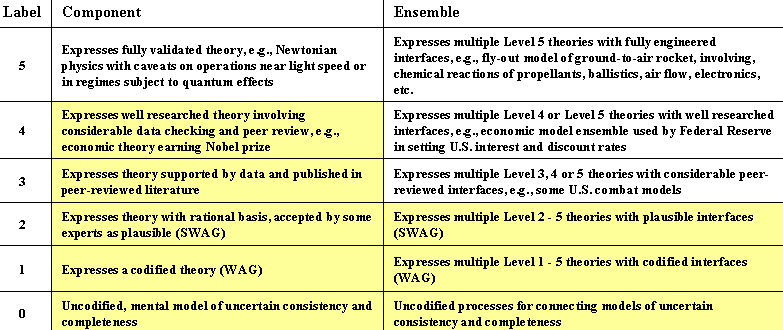
Validation metrics for conceptual models (CM) are as follows:
- Labels for individual model sub-components and for entire ensemble of
models
- “5” label meets the most stringent standards, “4” next most stringent,
etc.
- In general, the label for an ensemble will be lower than the labels for
its components
- Expectations for PMESII components and ensembles shaded in yellow
Verification metrics
The basic measures are
- Number of successful verification tests
- Number of unresolved problems
The results are shown over time in a table to place in proper context
- New tests refer to tests not included in previous testing
- Repeated tests
- Refer to tests that were in the previous testing
- Especially significant when moving from one version to another
Various pivot tables show the breakdown of
- Metrics collected for each model in the system
- Metrics collected on system-wide tests
- Overall metrics are accumulated
Description of unresolved problems
- Enable insight into nature of remaining verification issues
Validation metrics for coded models and the ensemble are divided into
nine components
- Political
- Military
- Economic
- Social
- Information
- Infrastructure
- DIME
- User Issues
- Connections (among models) [ensemble measurement only]
PMESII and DIME components are measured based on
- A large (eventually exhaustive) set of PMESII variables and DIME
functions that are relevant to the use
- Conceptual Model (CM) validity metric (1-5) for each variable and
function
- Suitability for the given use (fraction) for each variable and function
- Granularity of model match to use
- General match of model to use
- Right direction of change
- Right order of magnitude change
- PMESII components are also measured by the internal connection
validities within each model of the ensemble
Connections among the models are measured
- For each relevant model-model pair
- Suitability for the given use (fraction) for each pairing
- Granularity of model match to use
- General match of model to use
- Right direction of change
- Right order of magnitude change
User Issues are measured for each model and for the ensemble
- Ease of use
- Speed of use
- General fitness of the model or ensemble to the particular use
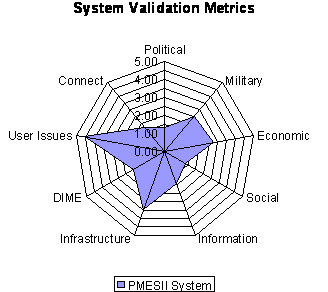
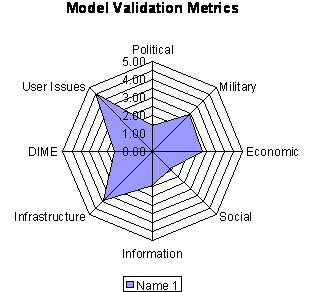
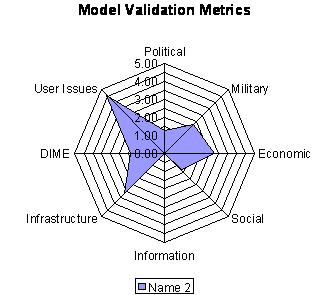
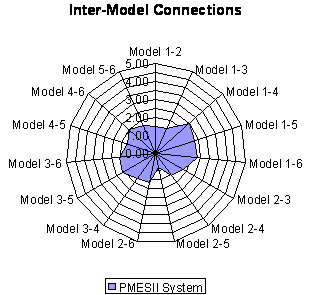
The values are entered into a spreadsheet, which calculates the values. To
enhance the transparency of those tests, the results are linked a set of
“spider” diagrams to the spreadsheet (see figures below). The “spider” diagrams
support visualization of multiple dimensions in a single chart and support an
overview and segmentation by each individual model. The metrics and their
diagrams provide the deep insight into the model’s strengths and weaknesses that
emerge from the VV&A process . The metrics and their diagrams also support
progress measurement as problems are fixed and are useful in conveying V&V
status to the user.
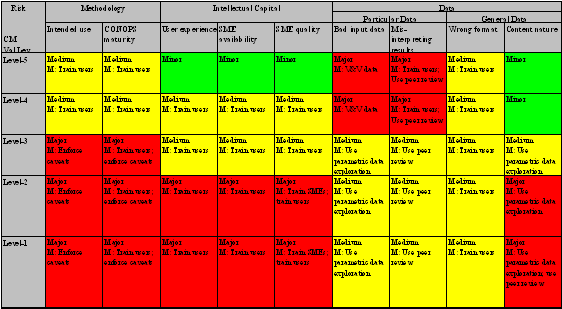
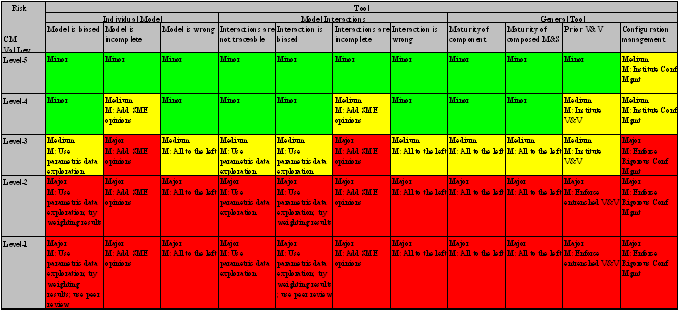
V&V Support to Risk Mitigation
Risk mitigation strategies are based on the CM validation level and the
various sources of risk. The two figures below show the levels of risk and
the appopriate mitigations for each combination.
V&V Support to Compressed and Hyper-Compressed Situations
DARPA proposed that COMPOEX should be modular and that the modules might be
modified for each particular use. Naturally, this poses validation problems as
the modified model does not necessarily partake of the validity of the base
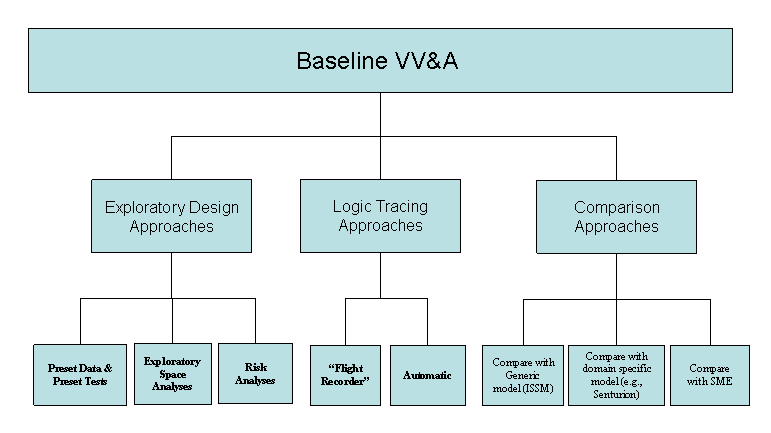
model. The VV&A procedures described above are referred to as the
"Baseline VV&A." Normal, developmental modifications are covered under the
baseline procedures; however, if the time between modification and use is on the
order of a month (Compressed) or a week (Hyper-Compressed), special procedures
are required. Several approaches and potential methods were explored, as
shown in the figure below.
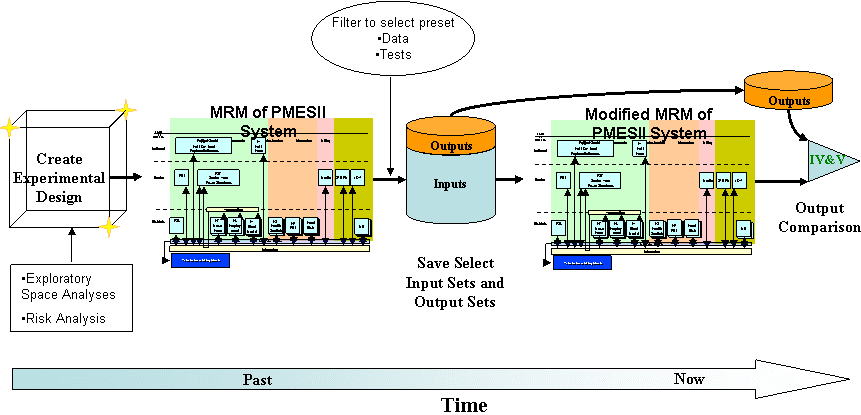
One promising method consists of exploring the PMESII space to determine a
small number of input sets that can be used to test any modified model.
This "Exploratory Design" is illustrated in the following figure.
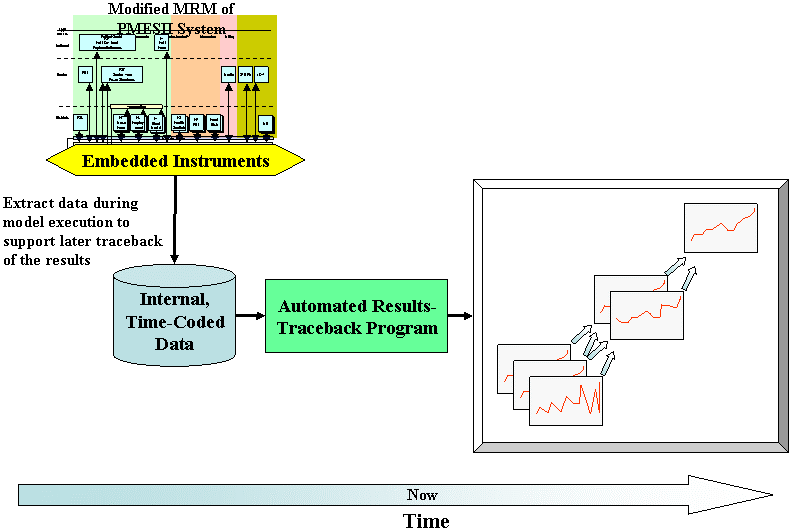
A second method for testing the validity of a modified model, "Logic
Tracing," is illustrated in the following figure. Time sequenced data are
captured during the model run and displayed as graphs, organized by precursors
to each given variable. This permits investigation of unexpected
behaviors.
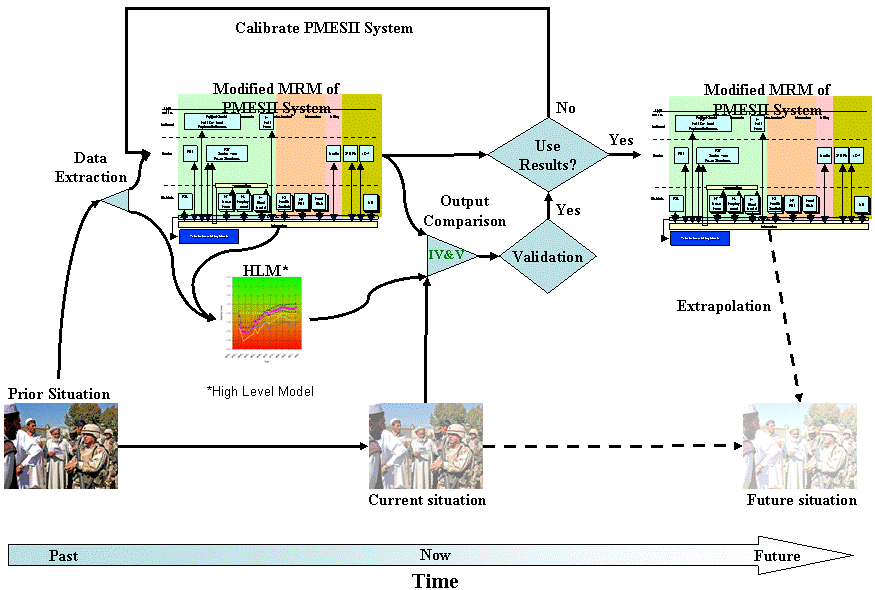
The third promising method involves the comparison of a high level model (HLM),
constructed independently of COMPOEX. COMPOEX and the HLM are each run
from some prior date up to the current date. Their outputs and the changes
in the real situation are compared. If the results are sufficiently close, then
COMPOEX can be used with some confidence to extrapolate the current situation.
If the results are not in agreement, an attempt can be made to calibrate COMPOEX
to the actual changes in the real situation. If successful, this
calibrated version can be used with some confidence. If the calibration is
unsuccessful, there may be an error in the modified model.
(Approved for Public Release, Distribution Unlimited)
Background:
For more on the details of tool requirements see Analytical Tools for OOTW.
For more on the ISSM (the prototype for the HLM) see Interim
Semi-static Stability Model (ISSM).
For details on the VV&A tool that was developed to implement these results,
see DIME/PMESII VV&A Tool.
A version of this work was also included as a
chapter in a book.
If you arrived here using a keyword shortcut, you may use your
browser's "back" key to return to the keyword
distribution page.
 Return to
Hartley's Projects Page

