New: Version 1.52, described at bottom of page. |
| Project Metadata | Keywords | |||||||||||||||||||||||||||||||||||||||||||||||||||||||||
|
|
Create a database system to support tracking and presenting the results of verification and validation of DIME/PMESII models (also known as Human Social Culture Behavior (HSCB) models). These results should be usable in making accreditation decisions, which would also be stored in the database.
|
|
The key issue was to reduce the resistance to actual performance of V&V while simultaneously ensuring that enough of the right data were captured to support accreditation decisions. Part of the resistance is due to the idea that V&V is esoteric and too hard for mere mortals, costly, and for DIME/PMESII models virtually impossible. The goal was to produce a tool that is practical and requires ordinary analyst-grade humans and is only moderately costly. The decision on what are the right data and how much is enough was based on years of experience, both personal and from other experts.
A secondary issue lay in the software engineering of the tool. Earlier tools had been constructed using a number of massive Excel workbooks, one for each model and one to collect the results. That method worked; however, it was clumsy and not scalable. The current tool is based on Microsoft Access.
The DIME/PMESII VV&A Tool has been used to test the VV&A process for the HSCB Testbed. It was also the primary source for the TRAC IW Metric Ontology. Results from these projects are being fed back into the design process for the next version of the Tool.
Several questions begin, "Why?"
There are several reasons.
The basis for the tool consists of
|
|
The MSIAC "Needs Statement" for VV&A tools says the following.
This tool does each of these things.
There are three principles underlying the tool.
A few concepts are needed to understand the tool.
The flow chart below identifies the processes needed for performing VV&A with this tool. The processes above the dashed line are preparation steps, defining: the theories that are used by the system, the data sources used by the system, the links between data sources and data sub categories, the system (models, modules, connections, and metadata), the requirements the system must meet, the people who are part of the VV&A process, and the test event (blue boxes). The preparation also includes defining the individual dynamic tests and the test stations on which the tests will be performed, assigning the tests to test stations, defining the fixed events (e.g., lunch breaks) for the testing, and creating the test schedule. The actual tests are divided into static tests, which can be performed in parallel to some of the preparatory steps because they do not involve running the system, and the dynamic tests, which do require system operations. Once all of the tests have been performed, they must be evaluated, after which any accreditation decisions can be made.
|
|
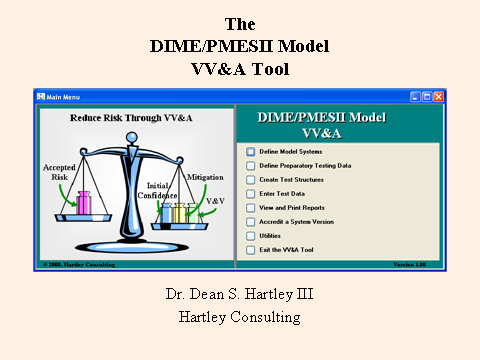
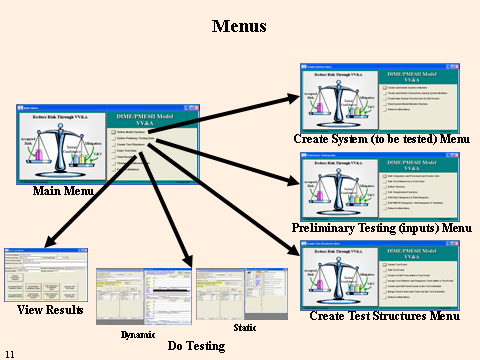
The tool opens on the main menu, showing sub-menus for creating the system to be tested, entering preliminary inputs, creating the test structures, doing the testing (both static and dynamic testing), viewing the results, and (not shown) accrediting the system and model versions.
|
|
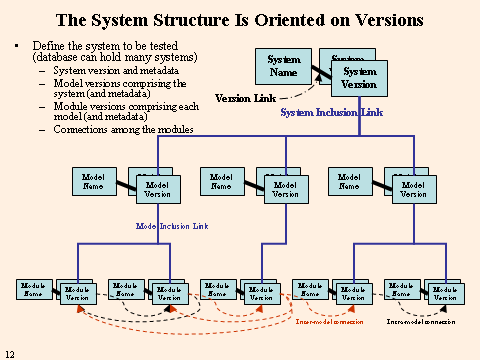
When you define a system, you define the version for the system and the models, with their versions, their modules, with their versions, and the connections among the modules, both intra-model and inter-model. A system may consist of a single model or a set of models that could be run independently. A model may consist of a single module or a set of modules. Modules may be separate programs or subroutines; however, they are considered as not being capable of being run independently. The connections are defined among the modules to allow for data flow within a model and between models; however, they are always defined by the module generating the output and the module ingesting the data. The connections should also be defined by the type of data being passed and the direction of data flow. Thus there may be multiple connections between a single pair of modules.
|
|
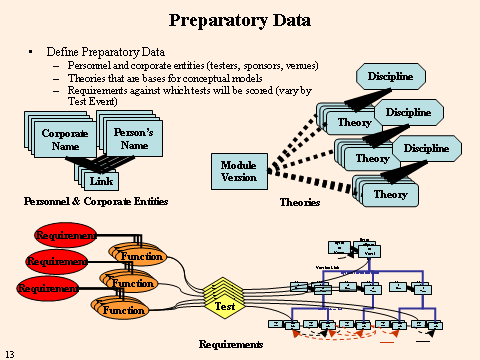
The required preliminary data include such things as the names of people who will be involved in testing and their corporate connection. This includes the people doing the testing, the sponsor(s) for the model, the accrediting authority, and so forth. Other preliminary data that can be entered before testing are the theories upon which the conceptual models rest and the data sets that will be used to feed the model. These items may also be added during testing. The requirements and requirement functions are general and preset; however, the particular ones to be used and the detailed requirements will be defined as part of the test creation process.
|
|
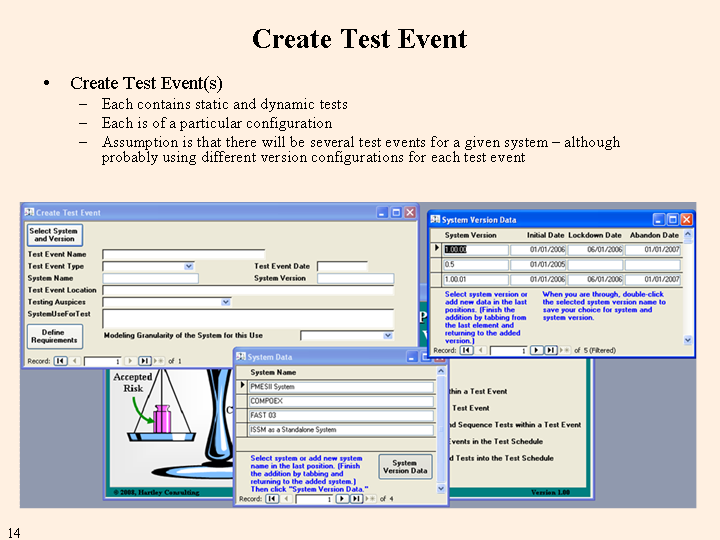
Once the system to be tested has been defined and the preliminaries are completed, you may create a formal test event - an event that will supply inputs to an accreditation decision, whether immediately or in the future. This test event can be Alpha, Beta, Acceptance, Periodic, or Triggered testing. Operational testing also generates inputs for accreditation decisions; but is treated differently as a shortcut method is provided to reduce the burden of creating the event and the tests.
|
|
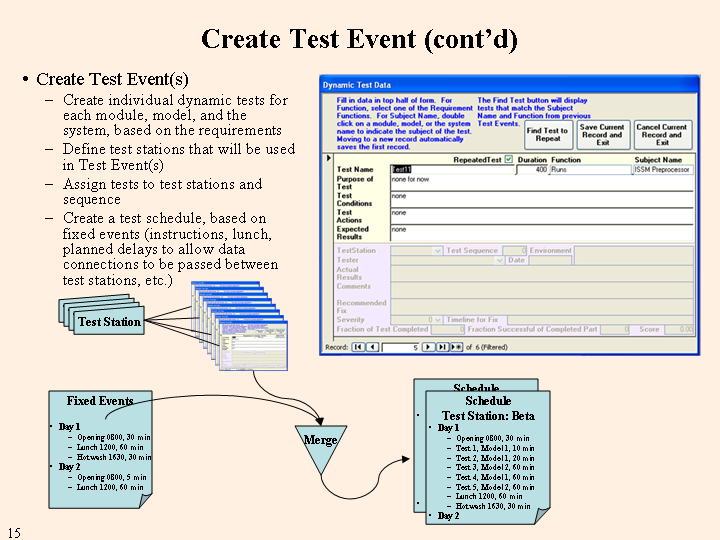
The second test structure is the individual dynamic test. These are tests that relate to the requirements through the requirement functions. They test individual items within the functions at the module, model, and system levels. Each test has its own purpose that describes the relationship to the function being tested. The test conditions describe what must be done to set up the test and the test actions describe how to conduct the test. The expected results give the basis for scoring the results of the test. The form in the upper right of the figure below shows the input format. (The lower part of the form will be used later to fill in the test results.) The "Find Test to Repeat" button makes it easier to fill in a test that should be repeated from some previous Test Event, either because it was a failure then or to make sure that intervening changes to the system have not introduced a new problem into an area that did not have a problem previously.
The third test structure is a description of the test stations, hardware and software, that will be used in the testing. The fourth structure is the assignment of tests to test stations.
The final test structure is the schedule. This is made up of two parts, the sequence of tests for each test station and a set of fixed events (events with fixed dates and times), such as opening remarks, breaks, lunch, hot washes at the end of each day, etc. The two parts are merged into a preliminary test schedule. Additional fixed events can be added that are test station-specific to introduce delays at one test station to allow for the completion of a test on another test station. The parts are remerged to produce the final test schedule.
|
|
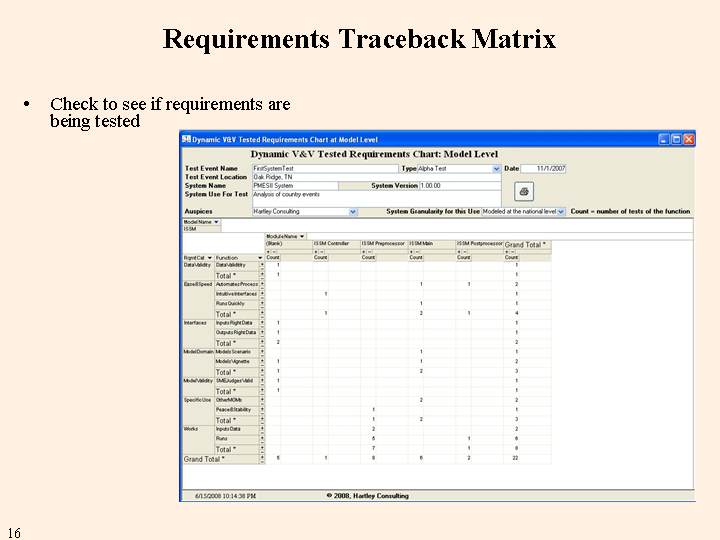
Before the test schedule is distributed, the requirements traceback matrix allows for a check to make sure that all of the requirements for the test event are being tested.
|
|
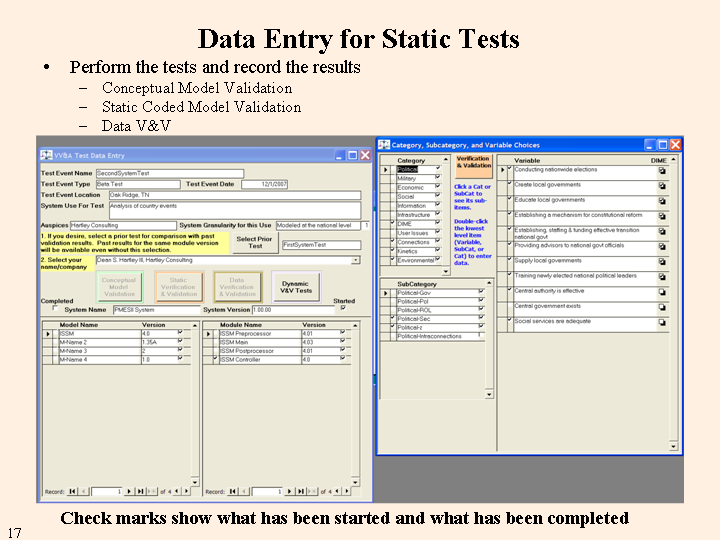
The static or bench tests do not have to be performed as part of the schedule of the test event because they don't require running the system. However, they must be performed using the same versions and should be performed prior to the dynamic tests. The V&V team can decide whether to include them as block test items in the test schedule, either as fixed events or as dummy dynamic tests, or to perform them off-schedule.
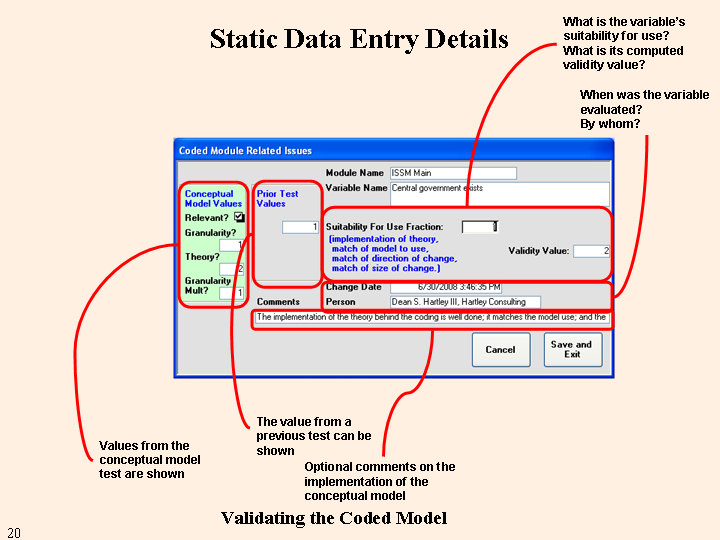
To aid the user in determining what tests have been performed, when the user enters data for a variable the system places a check mark beside the variable description. In the figure below, one variable does not yet have a check mark (lower right side, "Central government exists." Once the user has entered data for a variable within a SubCategory, the box to the right of its name is checked. When all of the variables in the Subcategory have been completed, the box to the left of the name is checked. The right and left boxes for each Category indicate when the Category has been started and finished. Similarly, each module and each model have right and left boxes to indicate their testing status (lower left in the figure). Finally, there are a pair of boxes for the system status as a whole (labeled "Started" and "Completed" above the model and module sections of the form).
|
|
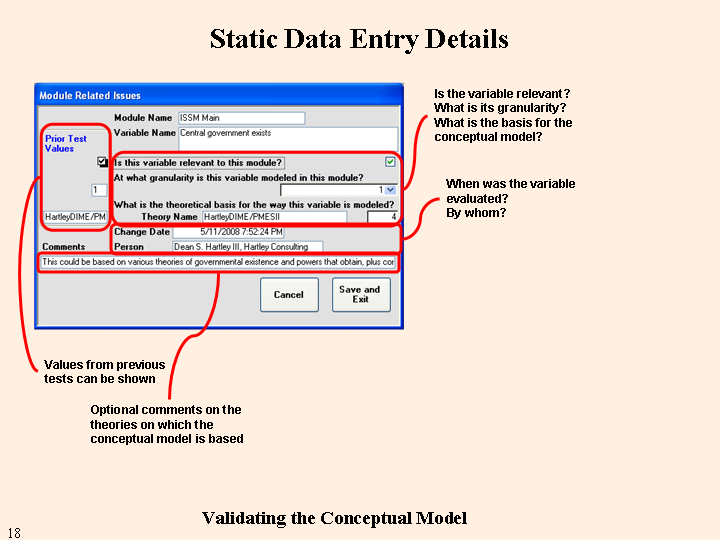
If a prior test was selected, the results are shown as a guide for the new entries. (If the version for a module has not changed since the last test, the previous results will show up in the current results areas whether a prior test was selected or not. The reason is that absent a change to the module, the answers to the static tests won't change.) If the variable is not meant to be modeled in this module, deselecting its relevance will prevent its scoring against the module. The granularity for the variable's modeling allows for comparison against the overall system granularity. Gross modeling of a variable when the system requires fine detail reduces the validity. The theory on which the conceptual model is based for this variable defines the maximum validity possible for this variable. The theory's validity is automatically entered when the theory is selected. The person rating the variable and the date are automatically entered. An optional memo (indefinite size) entry is provided for notes concerning the way the theory is used in modeling the variable.
|
|
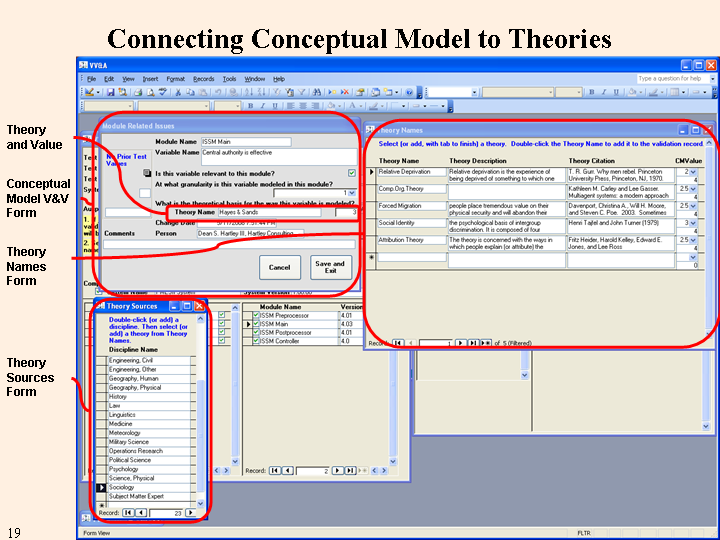
The figure below shows the process that is used in selecting the theory. You select a theory source to see the available theories. Once the proper theory is found, selecting it automatically loads its name and validity score into the static data entry form. Alternatively, new theories, or even new sources and theories may be added and selected. Download a file of theories by discipline here.
|
|
Similar forms are used for entering data on the model level variables and the connections.
The second type of static V&V concerns the implementation of the conceptual model. The major input is the Suitability for Use Fraction, which is a combined measure of how well the theory was implemented in code, the match to the system's use, and a rough estimate of its validity (direction and size of change versus reality).
|
|
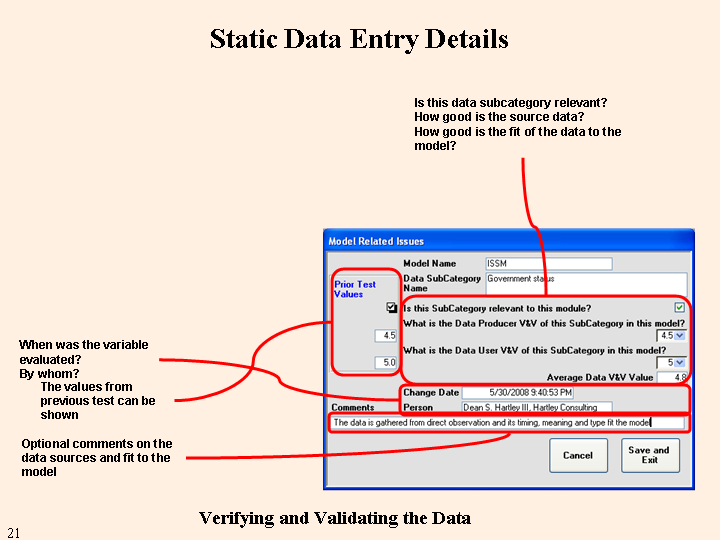
The third static V&V form addresses data verification and validation. There are two parts to this, Data Producer and Data User, V&V. The first refers to the quality of the raw data. The second refers to the processes needed in converting the raw data into model inputs. You select one of a set of choices that describe the situation, resulting in a numerical value being inserted into the form for the latter.
|
|
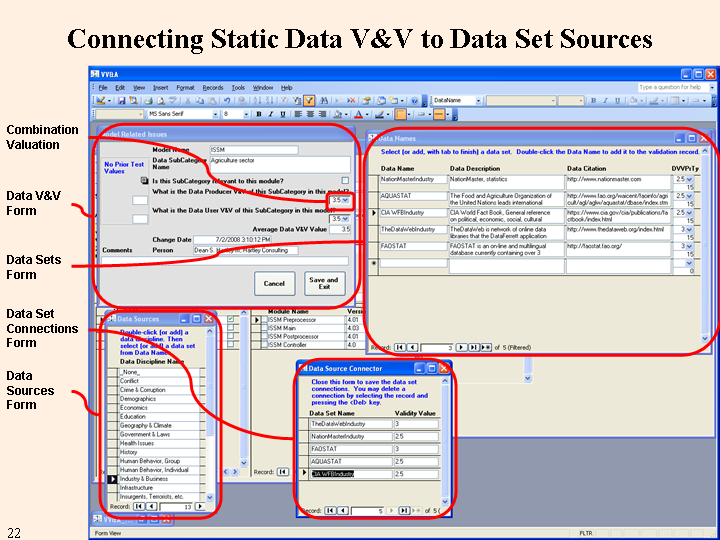
For the Data Producer value, you select one or more data sets that are used as sources for the particular data subcategory, as shown in the figure below. Each data name has its own value. The average of the selected data sets is automatically entered into the form. Download a file of data sources by data category here.
Technically, the values should be relative to a given use. If we were concerned with models of physical systems, we would have standards such as "for this use we need 4 significant digits; but for that use we only need 2." In such a situation, a data source with 2 significant digits and one with 4 would receive different valuations for one use and the same valuation for the second use. However, in our situation the data problems are much grosser - missing data for a country or a time period, different cutoff dates from one data source to another, different definitions for the categories, etc. These problems wash out questions of significant digits and apply roughly equally to all DIME/PMESII modeling uses that come to mind. Therefore, we can use "DIME/PMESII modeling" as the "use" against which we are judging all of the V&V valuations.
|
|
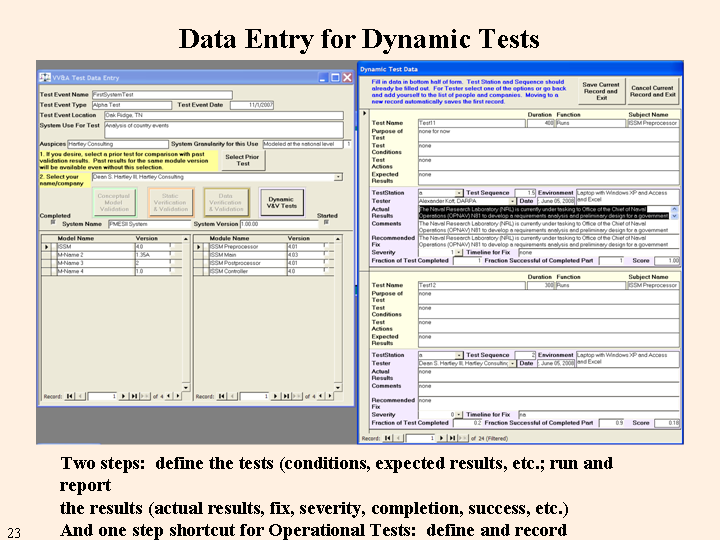
The figure below shows the data entry form for the dynamic tests that were created earlier. The upper half of the right hand side of the figure shows the form for one test. The upper half of this part of the form was filled in earlier (this figure has meaningless data entered for testing purposes). In the lower half of each test, the Test Station, Sequence, Environment, Tester, and Date are filled in automatically. The tester must fill in the actual results for the tests, and comments, the recommended fix (if needed), the severity of the problem (from none to critical), the timeline for fixing the problem and the numerical scores.
There are two scores that the user must enter, the fraction of the test that was completed and the fraction of the completed part that was successful. There are many reasons for a test not being completed, ranging from running out of time, to failure of a previous test from another model to provide the starting conditions, to failure of an early part of a multi-part test making testing the later parts impossible. The fraction complete score captures the information that only a part of the test was completed. The other score is an estimate of the success of the part of the test that was completed. Success is determined by comparing the actual results to the expected results.
Purists can argue that this permits artificial "pumping" of the results by adding in trivial tests. My experience with VV&A is that you need a base of simple tests that you expect to pass: e.g., {Test action: "double-click system icon"; Expected results: "main menu appears"}. Such tests don't take much time and they are necessary - and they provide a psychological boost. There will be plenty of "hard" tests. Explaining to a sponsor that a 25% success rate is "really good" because you only put hard tests on the schedule can be a losing proposition.
|
|
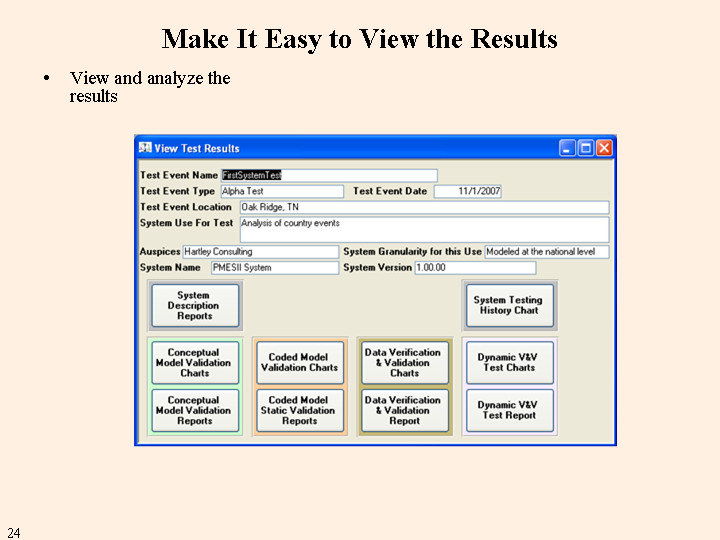
Testing is hard work. Documenting the testing after everyone has gone home is thankless work. Everyone wants to see the results at the end of the testing - and often the intermediate results at the end of each testing day. If you don't have the results to the sponsor while he or she is attending the Test Event, the chances of anyone but you reading the test report are low. The DIME/PMESII VV&A Tool reports the status almost instantaneously (some of the internal queries take a couple of minutes to execute). There are two types of outputs, reports and charts. The reports contain all of the details and provide complete documentation to support error correction and mitigation, system history needs, and accreditation decisions. The charts present the data in pictorial ways that support immediate identification of any problem areas and also support drilling down, if needed.
The figure below illustrates the form for selecting the outputs.
|
|
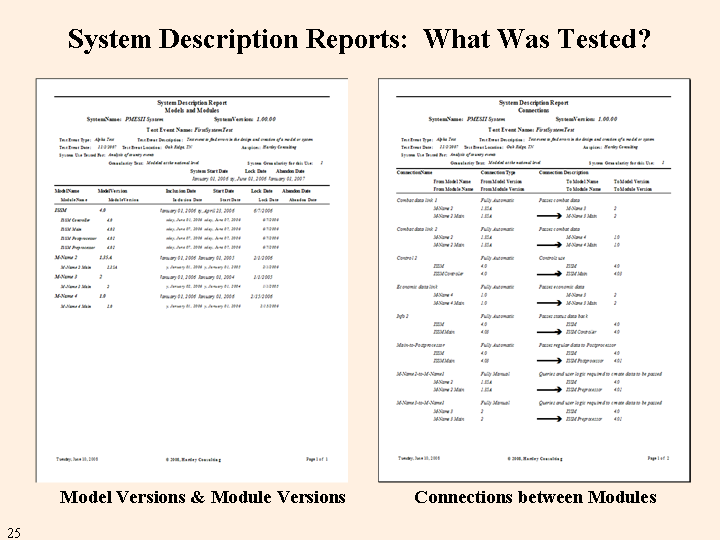
One system description report defines the models and their modules, with version numbers and metadata. The other report defines the data connections between pairs of modules that were defined for testing.
|
|
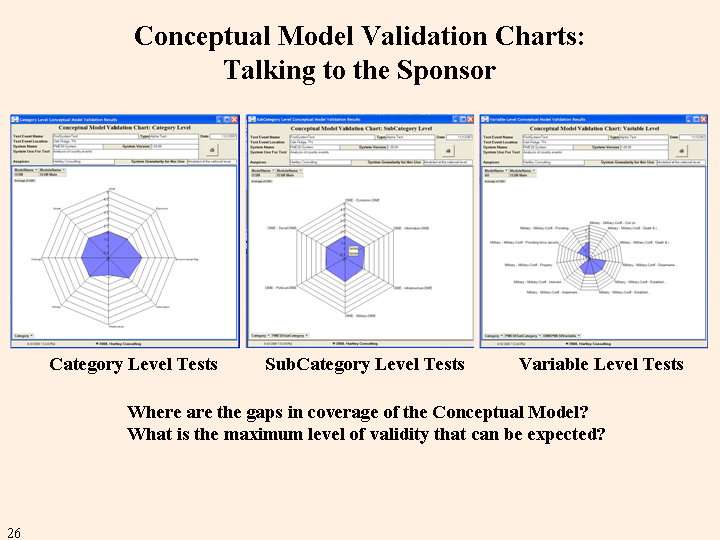
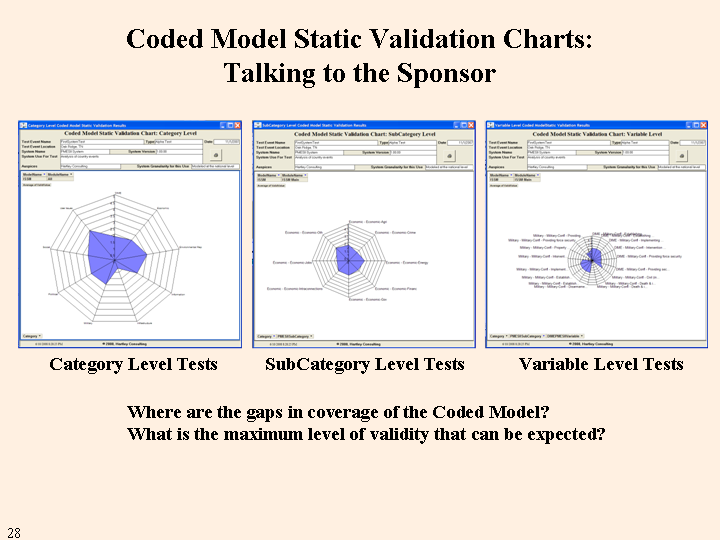
Conceptual model validity has two components, theory validity and coverage. There are three charts, Category level, SubCategory level, and Variable level. Each chart is a pivot chart that allows the user to display different parts of the data. The views in the figure below are all for one module; however, they can be changed to show several or all modules of one model or multiple models or the entire system. The Category level chart can be restricted to show only some of the categories; however, that is not particularly useful. The SubCategory chart can be restricted to show only some of the SubCategories for a particular Category, which is not particularly useful; however, it can be changed to show the values for each SubCategory for each Category in turn. Note that in this illustration, one of the Categories in the left-most chart shows a distinctly lower value than the others. The SubCategory chart for that Category might show the reason. The example below is not particularly illuminating, because it doesn't represent the Category in question. If it did, it would be indicating that perhaps the general theory level for that Category is lower than for other Categories because all of the SubCategories are showing similar results. Assume this had not been the case and the Variable chart has been set for the given Category and SubCategory. This chart shows the other possible reason for a low value, three of the variables have been set as not being represented in the module.
It is possible that the gaps mean that these variables are intentionally left out because they are covered in another module or in another model. This possibility can be easily checked by increasing the module and model inclusion specifications on the Variable chart. It is also possible that this represents a coverage lack in the system, which would require either mitigations in the system use, corrections to the system, or constraints on the eventual accreditation of the system.
|
|
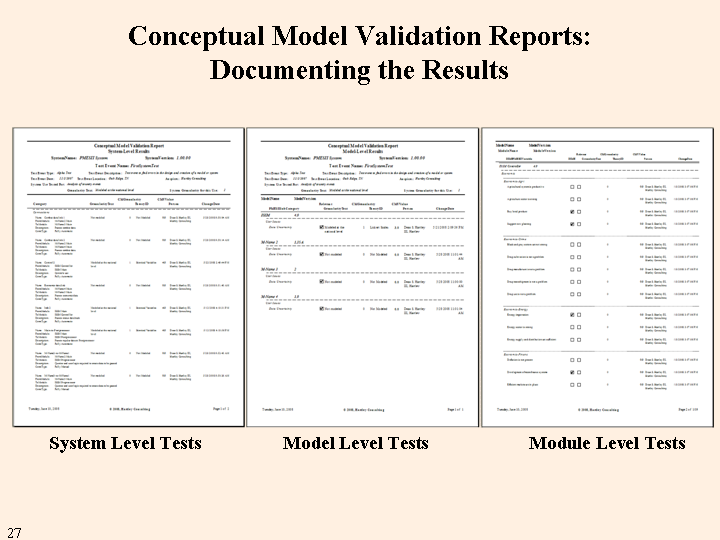
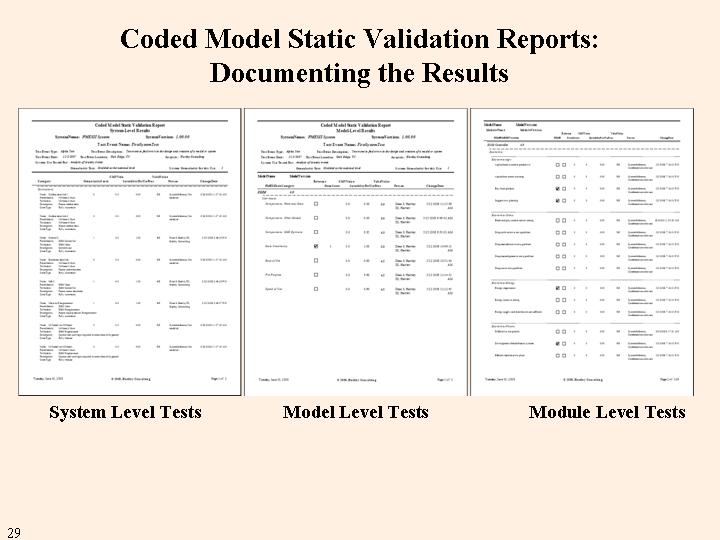
The complete conceptual model testing documentation is organized by system level, model level, and module level. All the data that was gathered for each test is included in one or the other of these reports. The system level and model level reports are one to two pages in length. The module level report has about 15 pages per module.
|
|
The coded model charts are similar to the conceptual model charts in format; however, the content is based on the combination of the Suitability for Use Fraction and the conceptual model valuation. Naturally this means that conceptual model coverage gaps are propagated to the coded model.
|
|
The coded model reports are similar to the conceptual model reports in the same way. The system level and model level reports are one to two pages long and the module level report is about 15 pages per module.
|
|
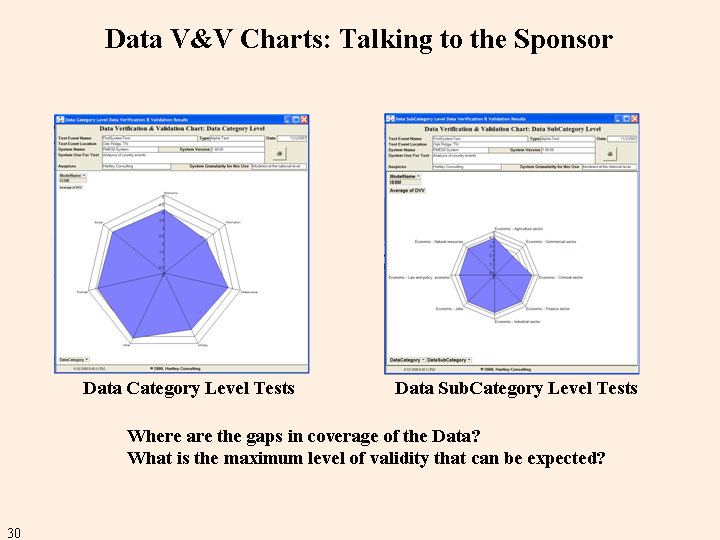
The data V&V charts are similar in format to the model V&V charts; however, there are only two levels, Data Category and Data SubCategory. The values that are displayed are combinations of the Data Producer V&V values and the Data User V&V values.
|
|
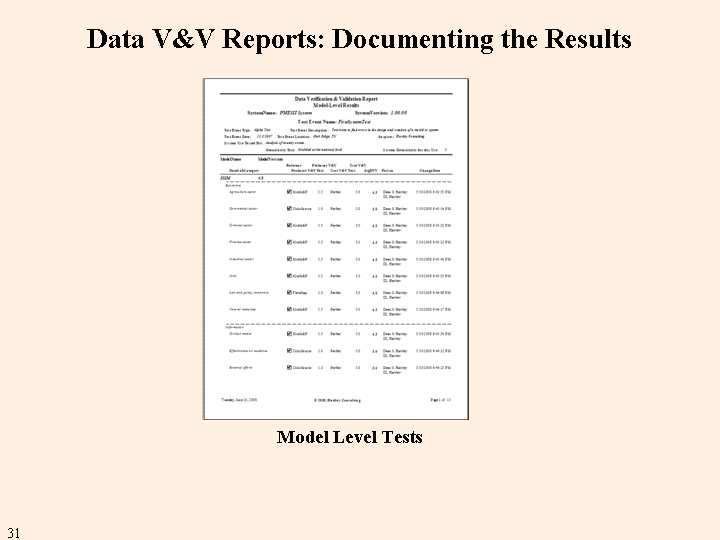
There is only one report because all of the tests are performed at (inputs for) the model level. There are about seven pages per model in the report.
|
|
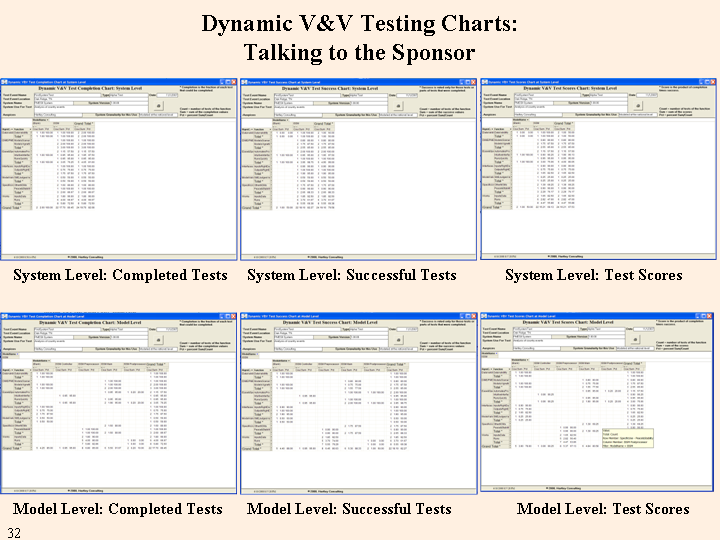
There are six different charts that display the results of the dynamic tests, three at the system level and three at the model level. The system level charts give the results for tests of each model in the system and system level tests. The model level charts give the results for each module of a selected model. The Completed Tests charts display the fraction of tests that were completed for each of the requirements and requirement functions. The Successful Tests charts display the success rates for completed tests for each of the requirements and requirement functions. The Test Scores charts similarly report the scores, which are the products of the completion and success rates.
As a general rule, "successful" Alpha tests will have relatively low scores because the goal of Alpha tests is to identify problems. The success criterion for Beta tests is much higher (perhaps 95% or better) because the problems identified in Alpha testing should have been fixed. Successive Alpha and Beta tests in a spiral development process should have similar criteria because new material is being tested (with some repetition to ensure new problems haven't been introduced). The success criterion for Acceptance tests should be near or at 100%.
|
|
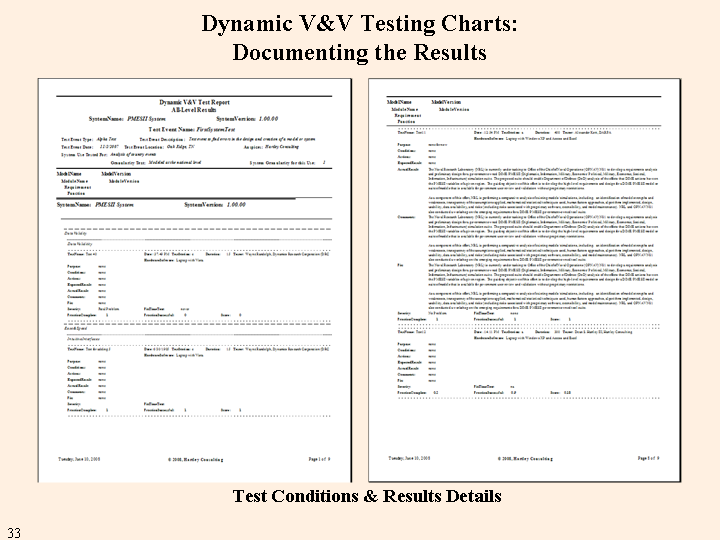
The documentation for the dynamic tests consists of a full listing of the test definitions and results. Because most of the data entry consists of memo items with indeterminate lengths, the number of pages in the report is variable, probably one to three tests per page.
|
|
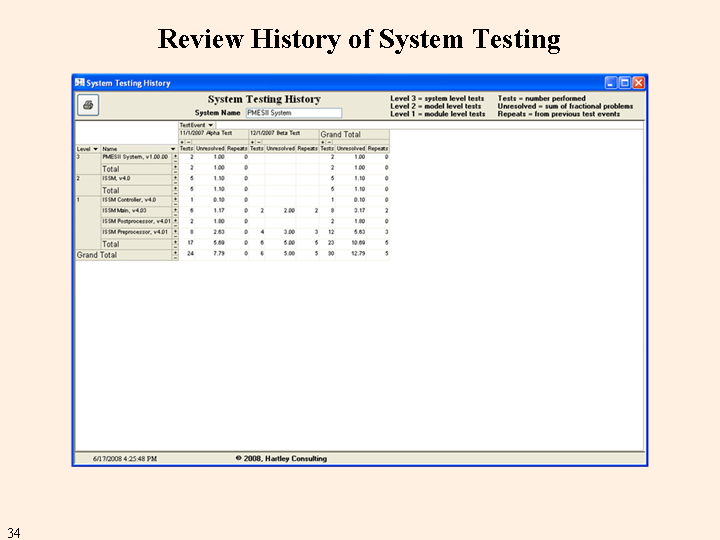
The final output report reviews the history of the tests on a given, named, system. That is, it includes tests on all versions of the system.
|
|
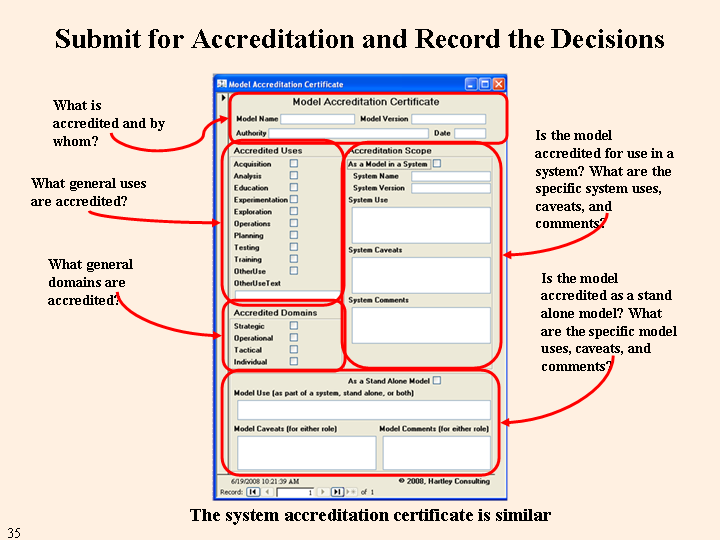
One of the goals of V&V is accreditation. (Obviously the other goals include system improvement and improved understanding of the system.) The DIME/PMESII V&V Tool provides for a systematic accreditation process and documenting the accreditation decisions. The system version as a whole is accredited (or not) and each model version within the system is accredited (or not). The figure below shows the model accreditation form, which automatically includes the verbiage from the system accreditation certificate. In each case, the accrediting authority specifies the general use or uses and domain or domains for which the system or model is accredited. Each model can be accredited either for use within the system, or as a stand alone model, or both. The verbiage entries allow for a more detailed description of the use which is being accredited, and caveats to that use, and any additional comments.
|
|
The DIME/PMESII VV&A Tool requires a number of functions to support its execution. These are listed below. Following that are a list of the types of data that must be entered into the Tool and a list of the outputs that are available. Finally, there is a list of functions that might be added to future versions of the product.
There are 21 different types of reports. A week long formal test event for a system consisting of four models, each with four modules can easily generate 800 pages of documentation to support accreditation.
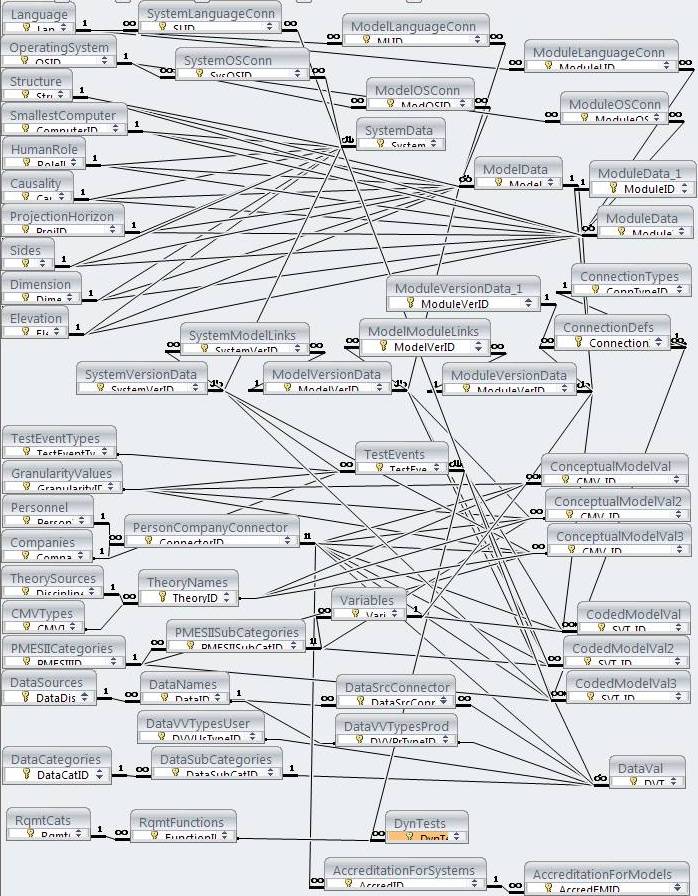
The figure below shows the tables that make up the database structure and the enforced relationships among the tables. The tables have been reduced in size, hiding the field names to allow a comprehensive view of the relationships in a single figure.
|
|
The database design also includes numerous forms, some of which have been illustrated above, and VBA code.
A version that doesn't require an installed version of Access 2003,
Data mining of past requirements and tests to inform new testing plans,
Networked data entry stations, as opposed to a single computer or a sneaker-net connection to collect data from separate computers,
Explicit risk mitigation strategies contained in the tool.
The DIME/PMESII VV&A Tool is a full-featured VV&A support tool that specifically supports the difficult domain of DIME/PMESII modeling. It provides:
In November 2011, the tool was updated to version 1.10. This version reflects the results of the Total IW Ontology effort.
In December 2011, the tool was updated to version 1.50.
In January 2012, the tool was updated to version 1.51.
In February 2012, the tool was updated to version 1.52.
If you arrived here using a keyword shortcut, you may use your browser's "back" key to return to the keyword distribution page.
![]() Return to Hartley's Projects Page
Return to Hartley's Projects Page