|
|
| Project Metadata | Keywords | ||||||||||||||||||||||||||||||||||||||||||||||||||
|
|
Support the US Southern Command (USSOUTHCOM), their contractor, Northrop Grumman Corporation (NGC), and their contractor, the University of Colorado - Denver, in Verification & Validation (V&V) of the Deployable Exercise Simulation II (DEXES)-II computer system. Hartley Consulting was hired to provide initial Verification and Validation (V&V) work on DEXES-II. In particular, Hartley Consulting was asked to support the validation process at the conceptual model level.
DEXES-II is an extendable dynamic simulation of the socio-political conditions that can lead to political instability, low intensity conflict, and non-kinetic warfare. DEXES-II is based on the previous DEXES, STRATMAS and NationLab models that were developed over 16 years by USSOUTHCOM and the US Joint Staff/J8. It is intended for use in at least two contexts: civil/military/police training exercises and evaluation, analysis and development of plans and policies.
The DEXES-II system is designed to control replications of the DEXES-II simulation, store its results and analyze and display them. The dynamic social, political, and economic variables are defined on a map with a spatial resolution of 2.5' (4.63 km at the equator) or 0.25° (27.78 km at the equator). Maps are displayed with Google Earth, or an equivalent Geographical Information System (GIS). In addition to the spatially-defined variables, DEXES II is designed to be used as a computer game, with role players making some decisions.
The figure below shows a diagram of the initial system. The DEXES-II system is comprised of three software components: the Webpage controller, the Database, and the DEXES-II simulation model. For convenience, all components at this level will be referred to as “models.” The components of the models will be called “modules:” the Control Module, the Database Module, the DEXES-II Simulation Module, and the DEXES Scenario Language Module. As illustrated, the system is run by one or more people and outputs various reports, including map graphics.
|
|
From a V&V perspective, there are several important points that must be made with reference to this figure. The first is that each of the components of the system must be subjected to testing. The second point is that each component must have version identification: test results for one version do not necessarily carry over to a new version.
V&V is the process of describing a system or model for the purpose of determining whether it is suitable for a particular purpose. The final determination of suitability is the responsibility of the user and is called Accreditation. Thus, the entire process, Verification, Validation and Accreditation, is known as VV&A. The project used the DIME/PMESII VV&A Tool to support the work.
M&S
Model: an abstraction of reality – can be mental, physical, computer code.
Simulation: a model that addresses change over time – can be acted out manually or run on a computer.
Conceptual Model: (general usage) the model that is intended to be implemented in computer code.
VV&A
Verification: is the process of determining that a model or simulation implementation accurately represents the developer's conceptual description and specification. Verification also evaluates the extent to which the model or simulation has been developed using sound and established software engineering techniques.
Validation: is the process of determining the degree to which a model or simulation is an accurate representation of the real-world from the perspective of the intended uses of the model or simulation.
Accreditation: is an official determination that a model is acceptable for a specific purpose.
Ontology
Taxonomy: a description of a domain characterized by a tree structure, each element having a single parent
Ontology: a domain description in which each element may have multiple parents and which may incorporate other descriptive elements (properties, part-of relations, etc.)
V&V includes both static and dynamic testing. The static testing defines the nature of the system, including such things as the components of the systems and the version numbers of those components and the linkages among the components. It also defines the coverage of the system over the domain in question. In this case, the domain is defined by an ontology of the Political, Military, Economic, Social, Information, and Infrastructure (PMESII) descriptors of the socio-political environment and the Diplomatic, Information, Military, and Economic (DIME) levers of power. The static conceptual model validation defines the links of the covered ontology elements to the theoretical bases of the system. The static data V&V defines the links of the covered ontology elements to the data sources. The static coded model V&V defines how well the covered ontology elements are implemented in the code. The dynamic testing includes various tests performed by running the system to determine whether the system performs as designed and how well the system replicates the real world. The results of all of these tests are used in the accreditation process. The figure below illustrates the VV&A elements and their connections. The four circled elements comprise the contents of the current effort.
|
|
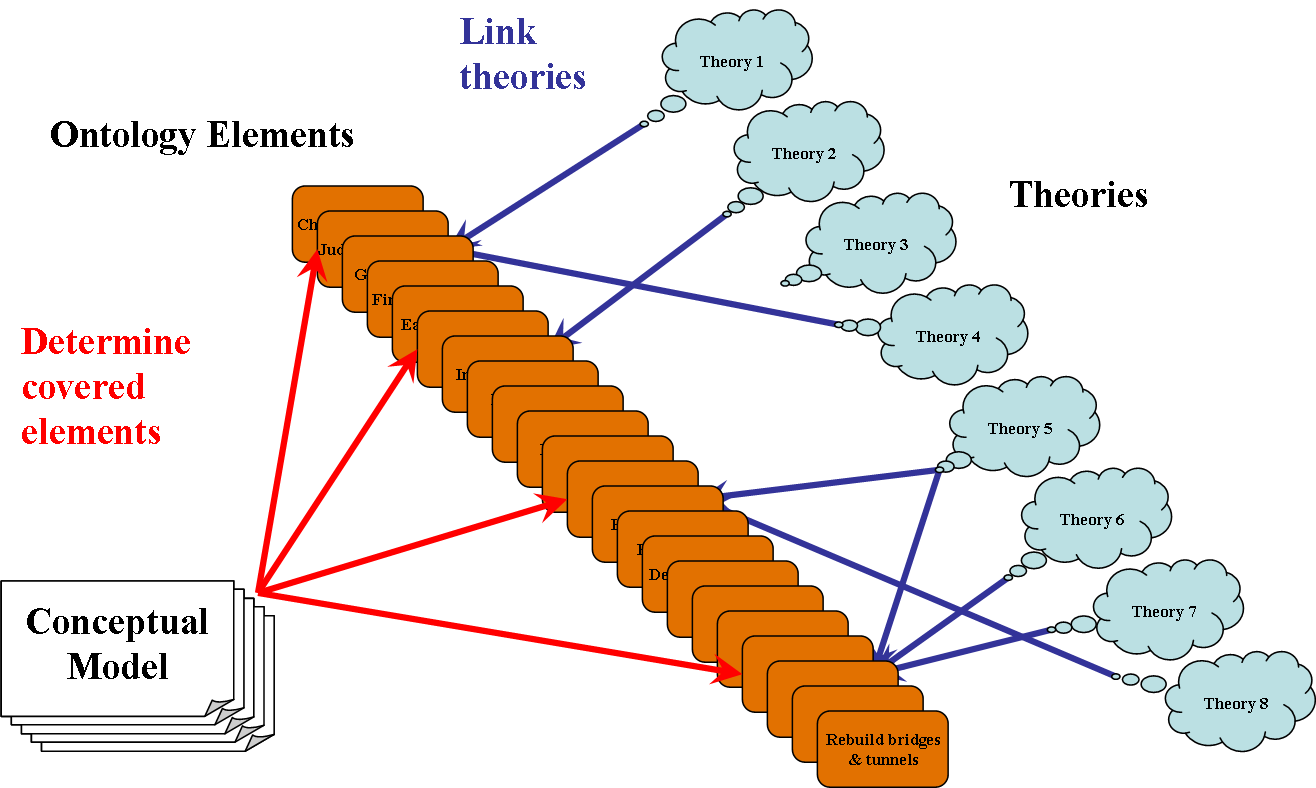
The ideal for VV&A of a model is to demonstrate that it is “correct,” or at least correct for some use. For extremely complex models, V&V may be essentially impossible, requiring the substitution of “suitable” for “correct.” For models of social interactions, e.g., war, peace keeping, nation building, etc., the theoretical basis of the social sciences does not support many decisions on “correctness.” For these models, V&V concentrates on improving the users’ understanding of the model – its good and bad points. One part of the validation process (of the conceptual model) devolves to an examination of the theoretical support that does exist. The organizational support for this examination consists of an ontology of the Social Domain, which describes all of the possible elements that might be covered by a social model. These elements are then linked to the theory or theories that are used to support them.
|
|
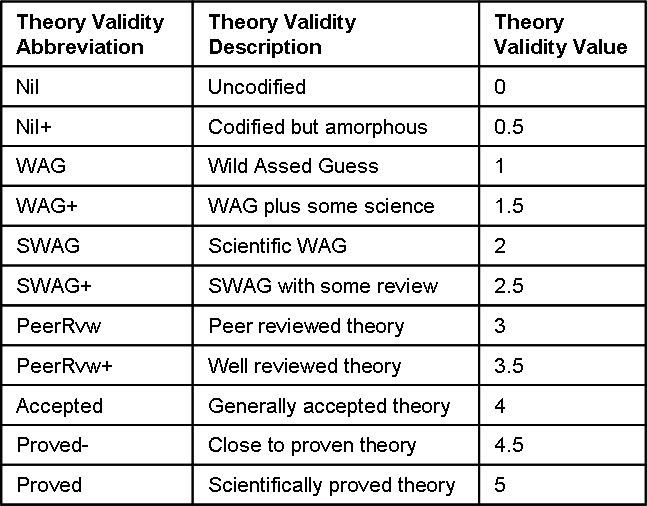
Another part of the VV&A process is defining the theories. Each theory, social, physical, or human expertise stand-in, must be defined, given citations, and rated as to approximate level of validity. The central point of conceptual model validation lies in understanding the validity of the theories that underpin the model. The maximal possible theoretical strength for any theory is a value of 5.0, which would be the equivalent of Newton’s or Einstein’s theories of gravitation. For PMESII models, this is impossible: most theories in the social sciences are rated as less than 3.5. The choices for theory validity are listed in Theory Validity table below.
|
|
The first step, "Define the System," resulted in the system diagram (first figure). The description is documented in the system description report. The System Description is in two parts, Models and Modules and Connections. More details concerning the choices available for the descriptions can be found on the Model Metadata Ontology webpage.
The Models and Modules part includes metadata, based on a metadata ontology defined to adequately describe DIME/PMESII systems. The system as a whole is described using the metadata ontology, as are each model and module. The seven high-level categories and their subcategories are listed below. In most cases, a single response is required for each subcategory. Two of these subcategories have two-part responses, as indicated. In four cases, multiple responses are supported, as indicated, e.g., the computer languages used in the code. Most subcategories have one sublevel of pre-determined choices to provide for consistency across systems and models, although additions to the set of choices can be made as needed.
· Names & Dates
Name: the system, model, or module name.
Version: the version identifier of the system, model, or module.
Inclusion Date: (for models and modules) the date the model version was included in the system version or the module version was included in the model version.
Start Date: the date the system, model, or module version was begun to be defined.
Lock Date: the date the system, model, or module version was completed. Any further changes would constitute a new version.
Abandon Date: the date on which the system, model, or module version is planned to be replaced by a new version or shelved.
· Computer Science
Computer: the minimal computer hardware required, whether laptop, cluster, supercomputer, etc.
Operating Systems: the computer operating systems alternatives (multiple responses supported).
Languages: the computer languages used (multiple responses supported).
· Dimensional Representation
Dimensions: the surface representation: none, some type of 2-dimensional representation, some type of 1-dimensional representation.
Elevation: the elevation/depth representation, if any.
Time Span: the general length of time represented in a model run, if any, e.g., days, months, years.
Time Interval: the smallest time interval represented, if any, e.g., hours, days, months.
Projection Horizon: the length of time for projected results, if any, units of time and numerical modifier (two-part response).
· Methods
Structure: the overall model methodology structure.
Methodology: the methodology types employed (multiple responses supported).
Causality: the type of causality, if any, used in the model.
· Coverage
Span: the geopolitical coverage, e.g., multinational, sub-national region, single individual.
Granularity: the basic smallest unit of measure. (There may be smaller units for specialized sub-components as long as they are minor elements of the model.)
PMESII Breadth: the number of PMESII+ categories considered relevant for the model as compared to the total number of PMESII+ categories (currently 8: political, military, economic, social, information, infrastructure, kinetic, and environment) (two-part response).
PMESII Detail: based on the number of variable classes considered relevant for the model, the total number of variable classes (currently 408), and the fraction of relevant categories. The total number of variable classes is multiplied by the fraction of relevant categories. The result is divided into the number of relevant variable classes to obtain a number representing a fraction of the possible detail.
· Players
Sides: the number of sides represented.
Human Role: the type of role humans play in the model, e.g., closed form, human-in-the-loop, etc.
· Usage
General Uses: the various types of uses for which the model is appropriate, includes the individual through strategic spectrum, the acquisition, analysis, etc., classification, and more detailed usage types (multiple responses supported).
Operational Status: the operational status, from conception to being retired "to the shelf."
In addition, the test event is described in the system portion.
· Test Event Name: free form.
· Test Event Type: selected from several types.
· Test Event Description: free form.
· Test Event Date: date.
· Test Event Location: free form.
· Auspices: selected from organizations.
· System Use Tested For: free form.
The Connections part contains the test event description and the system name and version to identify where the connections come from. The bulk of the Connections part consists of metadata on the connections among the modules of the system. All connections are based at the module level and each connection is one-way. Two-way connections are represented as two one-way connections.
· Name & Description: identification of the connection, includes a defining name, characterization as fully manual (all data must be reformatted and interpreted by human intervention), semi-automatic (all data must be reformatted, but not interpreted by human intervention), fully automatic (no human intervention required), or unknown (not known at that time).
· From Model Version: identification of the model passing the data, includes the model name and version that contains the relevant from-module.
· To Model Version: identification of the model receiving the data, includes the model name and version that contains the relevant to-module.
· From Module Version: identification of the module passing the data, includes the module name and version.
· To Module Version: identification of the module receiving the data, includes the module name and version.
There are 408 elements contained in the VV&A Tool that span the DIME/PMESII space (listed in the DIME/PMESII Structure report). These were examined to identify those that were relevant to the purposes of the DEXES-II. The relevant elements had to be separated into those that were actually modeled (covered) in the system and those that were not modeled (possibly to be included in later versions). Then, the proper theory for each covered element and its modeled level of granularity (for each module) had to be identified and entered into the VV&A Tool. The resulting Conceptual Model Validation report is in two parts, Graphic Overview Charts and Detailed Listings.
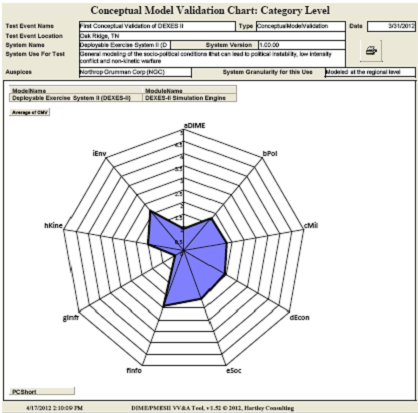
There are several charts in the Graphic Overview Charts part; all are “radar” charts (also known as “star” charts). In these charts several axes are represented as spokes from a central point. The average validity values of the linked theories, over the relevant ontology elements within each axis, is plotted on the axis and these points are connected with lines. The resulting polygon is filled in. The result looks like a radar screen with a star shaped interior, hence the names. This provides a profile of the relative theoretical strength of the model across the axes.
Note that only those elements that are described as “relevant” to the model are included in the average to avoid penalizing a model for not covering irrelevant elements. For example, a model might be divided into modules along the PMESII categories, so that one module contains only military elements and another module contains only economic elements. The charts for each module would have spikes in the appropriate category, with zero values in the other category. The model as a whole would have values in both categories with a connection between the two.
In general, a model will contain relevant elements that are not modeled (zero validity value). This is especially true in young models. Later versions of the model are expected to fill in these elements. Including these relevant but not modeled elements allows the chart to show improvement from one version to the next. This means that a model with a uniform, very good, theoretical basis of 3.5 for each modeled element will show lower validity values. For example, suppose one axis includes relevant modeled element with a 3.5 value and one relevant not-modeled element (0 value). The plotted value on that axis will be 1.75. Another axis might have two relevant modeled elements and one relevant not-modeled element and will show a plotted value of 2.33.
In general, a model will not have a uniform theoretical basis. Because of the nature of social science, not only does the validity of the theories vary, but also there are many gaps between the theories that exist. These gaps are filled by the modeler to the best of his or her ability. Elements that are thus filled will be in the WAG to SWAG range. Further, each element may be addressed by more than one theory, including gap-filling code. Thus the validity value of a given element will be the average of the theories that underlie it. This averaging impacts charts in an unseen manner. However, the details show each element and the theory or theories that underlie it, with their individual and averaged validity values.
Three of these charts represent PMESII elements.
The Conceptual Model Validation Chart: Category Level has nine axes: DIME, Political, Military, Economic, Social, Information, Infrastructure, Kinetics, and Environment. These labels are abbreviated and preceded by lower case letters to ensure the proper sequence of the axes. The chart mechanism allows for the chart to represent all of the models as a whole or a subset of the modules and one or more of the modules. Because all of the PMESII variables are contained in a single module in this system, only one of the possible charts is included in the output. That chart is the one that only shows the DEXES II model and its Simulation Engine module.
|
|
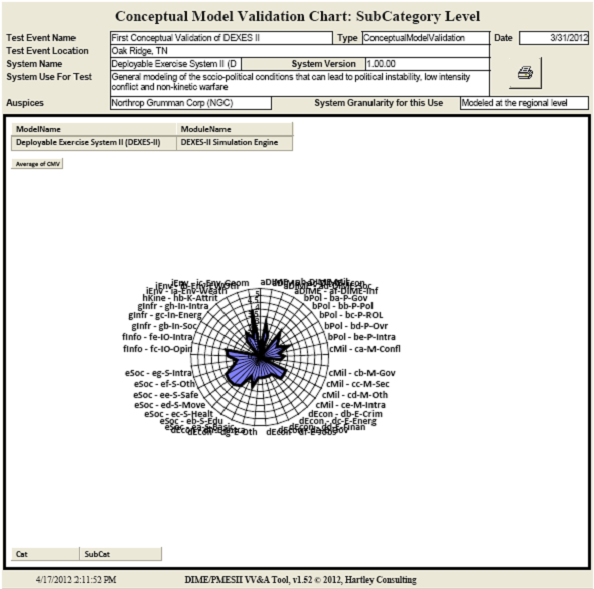
The Conceptual Model Validation Chart: SubCategory Level has a large number of possible axes, consisting of the all of the subcategories of the nine categories. Again, only the chart for the DEXES II model and its Simulation Engine module is included. The mechanism of the chart allows for a selection of the axes to be displayed. Only those with relevant elements are displayed in the output chart.
|
|
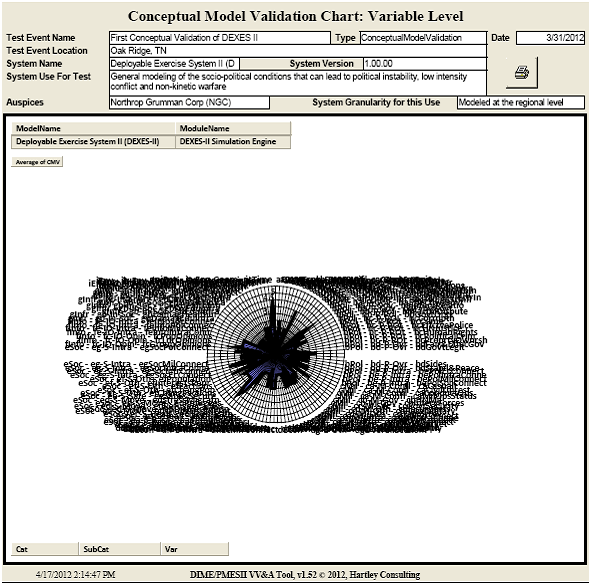
The Conceptual Model Validation Chart: Variable Level has 408 possible axes, the total number of ontology elements (variables).
|
|
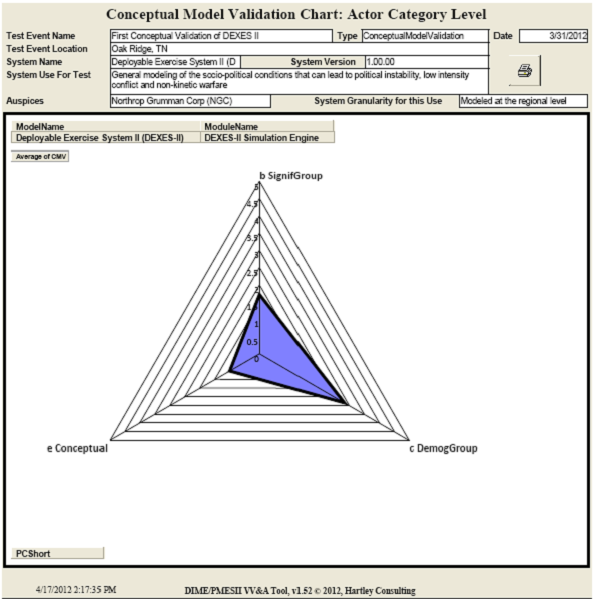
Three charts represent other divisions of the ontological elements: Actor Categories, Action Categories, and Environment Categories. The Actor Categories chart is shown.
|
|
While the charts display overviews of the conceptual model validation results that are useful for a broad understanding, the Detailed Listings provide a complete description of the results, necessary for a complete understanding of the model. There are three separate listings: System-Level Results, Model-Level Results, and Module-Level Results.
System-Level Results describe the Connections and their theoretical bases. Each connection is described, giving its name, from-module, to-module, and connection type. The validation effort is described, giving the person performing the test and the date of the test. The results are listed, giving the granularity text and numerical value, the overall conceptual model validity value (CMVValue), each theory underlying the connection (with name, description, theory validity abbreviation, and value), and any comments about the connection or test.
Model-Level Results describe the results of the model-level tests. For the conceptual model validation process, these are limited to the User Issue of Data Uncertainty. Each model is listed and the results for that model are shown. Where the Data Uncertainty issue is relevant, that box is checked and the same type data (person, granularity, overall CMVValue, theory results, and comments) are shown.
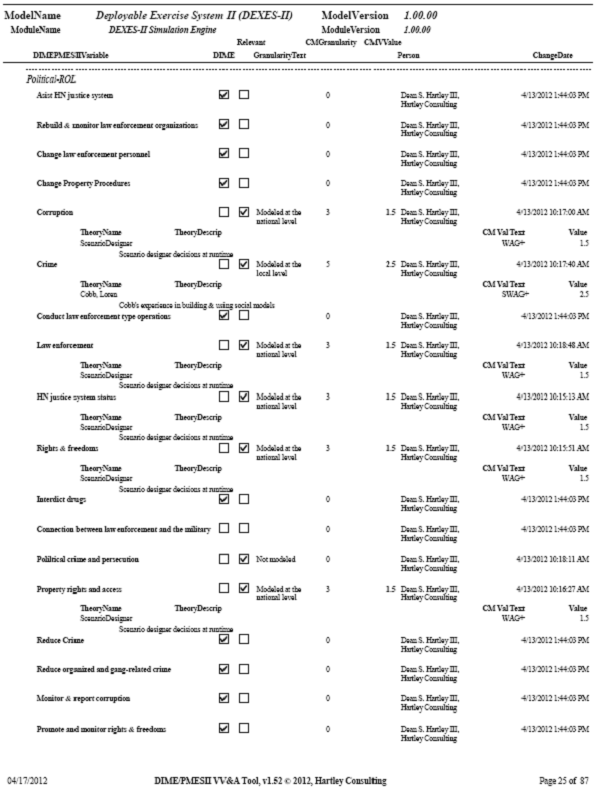
Module-Level Results describe the results of the module-level tests. This is the longest listing and contains the bulk of the results. It is organized by model and then module within model. For each module, the entire set of ontology elements is listed, organized by PMESII Category, PMESII SubCategory and element (DIMEPMESIIVariable). Each element is named and check boxes show whether it is also a DIME variable and whether it is “relevant.” The relevant elements show the granularity at which it is modeled, the overall CMVValue, the tester and date, the theories, and any comment. Each theory shows the theory name, description, theory validity abbreviation, and value. One page of the report is shown as an example.
|
|
The Theory Listing recaps the theories that are used in the system. It is organized by model and module with each model. For each module, each theory that is used by the module is listed. The name, description, citation and CMVValue for the theory are shown. This is followed by a list of each ontology element that uses the theory. Each element is named; its granularity is given; the tester and date are given; and any comments are listed.
Social Ontology
Conceptual Model Validation
Support Structures (GUI, model control, output control)
Social Modeling
If you arrived here using a keyword shortcut, you may use your browser's "back" key to return to the keyword distribution page.
![]() Return to Hartley's Projects Page
Return to Hartley's Projects Page